Advertisements
Advertisements
प्रश्न
Draw the speed-time graph of a body when its initial speed is not zero and the speed increases uniformly with time.
Advertisements
उत्तर

Speed time graph of a body when itS Initial speed is not ze ro and and speed increase uniformly with time.
APPEARS IN
संबंधित प्रश्न
A body is moving uniformly in a straight line with a velocity of 5 m/s. Find graphically the distance covered by it in 5 seconds.
A car of mass 1000 kg is moving with a velocity of 10 m s−1. If the velocity-time graph for this car is a horizontal line parallel to the time axis, then the velocity of car at the end of 25 s will be :
Multiple choice Question. Select the correct option.
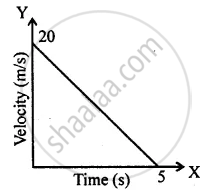
The distance covered in the adjoining velocity-time graph is :
Draw the following graph:
Speed versus time for a non-uniform acceleration.
Draw the following graph:
Speed versus time for a uniformly retarded motion.
Figure shows displacement- time graph of two objects A and B moving in a stra ight line. Which object is moving fa ster?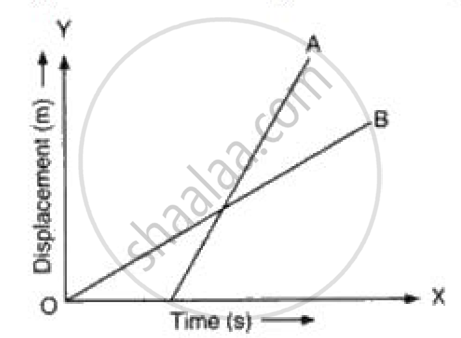
Its time-displacement graph is a straight line.
Draw velocity-time graph to show:
Zero acceleration
Write a sentence to explain the shape of graph.
What does the slope of velocity-time graph represent?
Sketch the shape of the velocity-time graph for a body moving with:
Uniformly velocity
