Advertisements
Advertisements
Question
A ball is thrown up vertically and returns back to thrower in 6 s. Assuming there is no air friction, plot a graph between velocity and time. From the graph calculate
- deceleration
- acceleration
- total distance covered by ball
- average velocity.
Advertisements
Solution
A ball is thrown up vertically and returns to thrower in 6s. It means the ball takes 3s to reach the highest point and 3s to reach the earth from the highest point.

For the upward motion of a ball
u = ?
v = 0
a = −g = −10 ms−2
t = 3s
v = u + at
0 = u − 10(3)
u = 30 m/s
⇒ In the graph, OA = CD = 30 m/s
(i) When the ball moves upwards, then it decelerates.
From graph, deceleration = − slope of graph AB
= `-"OA"/"OB"=-30/3` = −10 ms−2
(ii) When ball falls downwards then acceleration = Slope of v.t. graph BC
= `"CD"/"BD"=30/3` = 10 ms−2
(iii) Total distance covered = area under v.t. graph
= ar(ΔOAB) + ar(ΔBCD)
= `1/2xx"OB"xx"OA" + 1/2xx"BD"xx"CD"`
= `1/2xx30xx3+1/2xx30xx3`
= 45 + 45
= 90 m
(iv) Ball returns back to thrower in 6s.
⇒ Displacement after 6s = 0
Average velocity = `"Time distance covered"/"Total time taken"=0/6` = 0
Average speed = `"Total distance covered"/"Total time taken"=90/6` = 15 ms−1
APPEARS IN
RELATED QUESTIONS
Name the two quantities, the slope of whose graph give acceleration.
The velocity-time graph for part of a train journey is a horizontal straight line. What does this tell you about its acceleration ?
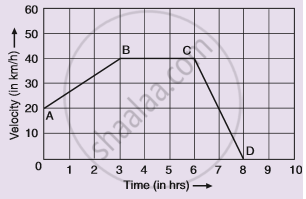
Given alongside is the velocity-time graph for a moving body :
Find :
(i) Velocity of the body at point C.
(ii) Acceleration acting on the body between A and B.
(iii) Acceleration acting on the body between B and C.
What type of motion is represented by the following graph ?
A car of mass 1000 kg is moving with a velocity of 10 m s−1. If the velocity-time graph for this car is a horizontal line parallel to the time axis, then the velocity of car at the end of 25 s will be :
Draw a displacement-time graph for a boy going to school with uniform velocity.
From the velocity – time graph given below, calculate Average velocity in region CED.

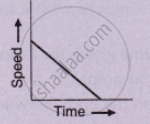
What can you conclude if the speed-time graph of a body is a straight line sloping upwards and not passing through the origin?
Interpret the following graph: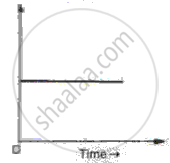
A straight line parallel to the x-axis in the velocity-time graph represents the object moving in ______.
