Advertisements
Advertisements
Question
A train starting from rest picks up a speed of 20 ms−1 in 200 s. It continues to move at the same rate for the next 500 s and is then brought to rest in another 100 s.
- Plot a speed-time graph.
- From graph calculate
(a) uniform rate of acceleration
(b) uniform rate of retardation
(c) total distance covered before stopping
(d) average speed.
Advertisements
Solution
(i)

(ii)
(a) Uniform rate of acceleration = Slope of v.t. graph from O to A.
= `"AE"/"OE"=20/200` = 0.1 ms−2
(b) Uniform rate of retardation = Slope of v.t. graph from BC
= `"BD"/"CD"=20/100` = 0.2 ms−2
(c) Total distance covered before stopping
= ar(ΔOAE) + ar(ΔABDE) + ar(ΔBCD)
= `1/2xx"OE"xx"AE"+"AE"xx"ED" + 1/2xx"BD"xx"DC"`
= `1/2xx200xx20+20xx500+1/2xx20xx100`
= 2000 + 10000 + 1000
= 13000 m
= 13 km
(d) Average speed = `"Total distance covered"/"Total time taken"=13000/800`
= `130/8`
= 16.25 ms−1
APPEARS IN
RELATED QUESTIONS
Draw a velocity-time graph to show the following motion :
A car accelerates uniformly from rest for 5 s ; then it travels at a steady’ velocity for 5 s.
Show by using the graphical method that: `s=ut+1/2at^2` where the symbols have their usual meanings.
What type of motion is represented by the following graph ?
Multiple choice Question. Select the correct option.
In the velocity-time graph, the acceleration is
Represent the location of an object described as at 15 m, 45o west of north, on a graph paper.
The area under a speed-time graph in a given intervals gives the total distance covered by a body irrespective of its motion being uniform or non-uniform.
Draw the following graph:
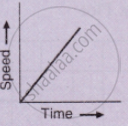
Speed versus time for a fluctuating speed.
Draw the following graph:
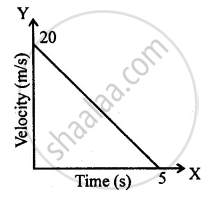
Speed versus time for a uniformly retarded motion.
Interpret the following graph: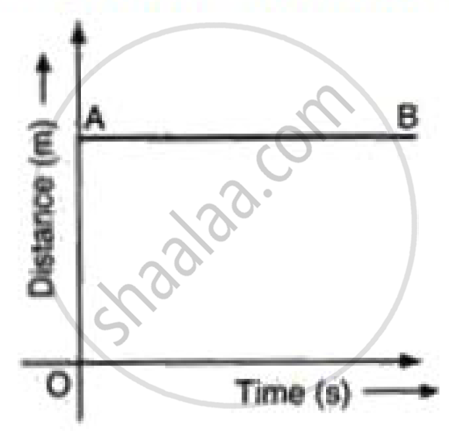
Figure shows the distance-time graph of three students A, B and C. On the basis of the graph, answer the following :
Will the three ever meet at any point on the road?
