Advertisements
Advertisements
प्रश्न
A train starting from rest picks up a speed of 20 ms−1 in 200 s. It continues to move at the same rate for the next 500 s and is then brought to rest in another 100 s.
- Plot a speed-time graph.
- From graph calculate
(a) uniform rate of acceleration
(b) uniform rate of retardation
(c) total distance covered before stopping
(d) average speed.
Advertisements
उत्तर
(i)

(ii)
(a) Uniform rate of acceleration = Slope of v.t. graph from O to A.
= `"AE"/"OE"=20/200` = 0.1 ms−2
(b) Uniform rate of retardation = Slope of v.t. graph from BC
= `"BD"/"CD"=20/100` = 0.2 ms−2
(c) Total distance covered before stopping
= ar(ΔOAE) + ar(ΔABDE) + ar(ΔBCD)
= `1/2xx"OE"xx"AE"+"AE"xx"ED" + 1/2xx"BD"xx"DC"`
= `1/2xx200xx20+20xx500+1/2xx20xx100`
= 2000 + 10000 + 1000
= 13000 m
= 13 km
(d) Average speed = `"Total distance covered"/"Total time taken"=13000/800`
= `130/8`
= 16.25 ms−1
APPEARS IN
संबंधित प्रश्न
What can you say about the motion of a body if its speed-time graph is a straight line parallel to the time axis ?
What does the slope of velocity-time graph represent?
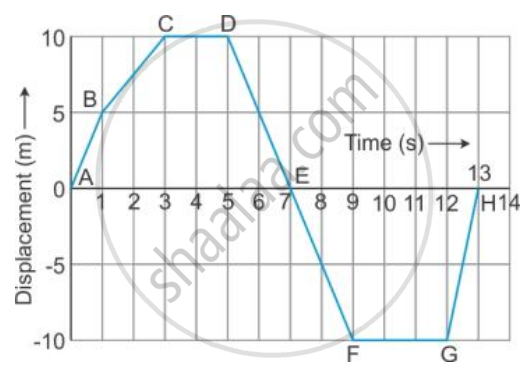
From the displacement-time graph of a cyclist given below in the Figure, find The time after which he reaches the starting point .
Multiple choice Question. Select the correct option.
A graph is a straight line parallel to the time axis in a distance-time graph. From the graph, it implies:
From the velocity – time graph given below, calculate Distance covered in the region ABCE.

Draw the following graph:
Speed versus time for a uniformly retarded motion.
Its time-displacement graph is a straight line.
Draw distance-time graph to show:
Decreasing velocity
The area under velocity – time graph represents the ______
Slope of the velocity-time graph gives ______.
