Advertisements
Advertisements
प्रश्न
A train starting from rest picks up a speed of 20 ms−1 in 200 s. It continues to move at the same rate for the next 500 s and is then brought to rest in another 100 s.
- Plot a speed-time graph.
- From graph calculate
(a) uniform rate of acceleration
(b) uniform rate of retardation
(c) total distance covered before stopping
(d) average speed.
Advertisements
उत्तर
(i)

(ii)
(a) Uniform rate of acceleration = Slope of v.t. graph from O to A.
= `"AE"/"OE"=20/200` = 0.1 ms−2
(b) Uniform rate of retardation = Slope of v.t. graph from BC
= `"BD"/"CD"=20/100` = 0.2 ms−2
(c) Total distance covered before stopping
= ar(ΔOAE) + ar(ΔABDE) + ar(ΔBCD)
= `1/2xx"OE"xx"AE"+"AE"xx"ED" + 1/2xx"BD"xx"DC"`
= `1/2xx200xx20+20xx500+1/2xx20xx100`
= 2000 + 10000 + 1000
= 13000 m
= 13 km
(d) Average speed = `"Total distance covered"/"Total time taken"=13000/800`
= `130/8`
= 16.25 ms−1
APPEARS IN
संबंधित प्रश्न
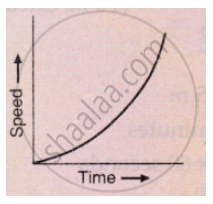
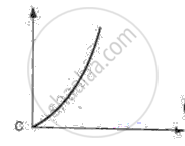
What conclusion can you draw about the acceleration of a body from the speed-time graph shown below .
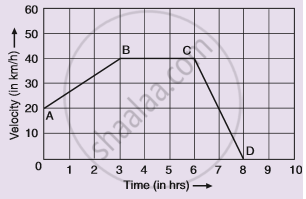
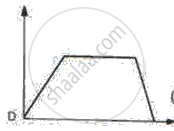
Given alongside is the velocity-time graph for a moving body :
Find :
(i) Velocity of the body at point C.
(ii) Acceleration acting on the body between A and B.
(iii) Acceleration acting on the body between B and C.
Draw a velocity-time graph for the free fall of a body under gravity starting from rest. Take g = 10m s-2
The area under a speed-time graph in a given intervals gives the total distance covered by a body irrespective of its motion being uniform or non-uniform.
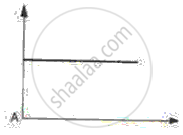
Draw the speed-time graph of a body when its initial speed is not zero and the speed increases uniformly with time.
Draw the following graph:
Speed versus time for a fluctuating speed.
Given below are the speed -time graphs. Match them with their corresponding motions :
 |
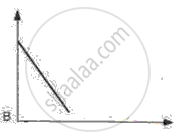
(a) Uniformity retared motion |
 |
(b) Non-uniformity acceleration |
 |
(c) Non-uniform motion |
 |
(d) uniform motion |
Slope of the velocity-time graph gives ______.
The area of the velocity-time graph gives the displacement of the body.
The given graph shows the variation of velocity (v) with position (x) for a particle moving along a straight line
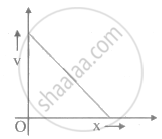
Which of the following graph shows the variation of acceleration (a) with position (x)?
