Advertisements
Advertisements
प्रश्न
The area under velocity – time graph represents the ______
पर्याय
velocity of the moving object.
displacement covered by the moving object.
speed of the moving object.
acceleration of the moving object
Advertisements
उत्तर
The area under velocity – time graph represents the displacement covered by the moving object.
Explanation:
The area under a velocity-time graph represents the displacement of the moving object. This is because:
Displacement = Velocity × Time
In a velocity-time graph, the product of velocity and time is graphically represented by the area under the curve.
APPEARS IN
संबंधित प्रश्न
Derive the following equation of motion by the graphical method : v2 = u2 + 2as, where the symbols have their usual meanings.
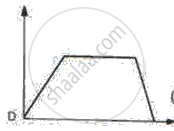
From the velocity – time graph given below, calculate Distance covered in the region ABCE.

From the velocity – time graph given below, calculate Average velocity in region CED.
Given on th e side are a few speed - time graphs for various objects moving along a stra ight line. Refer below figure. (a), (b), (c) and (d).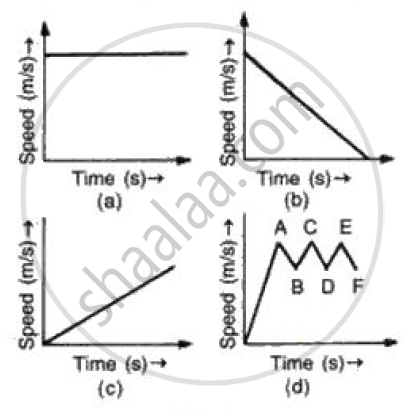
Which of these graphs represent
(a) Uni form motion
(b) Motion with speed increasing
(c) Motion with speed decreasing and
(d) Motion with speed oscillating.?
Draw the speed-time graph of a body starting from some point P, gradually picking up speed, then running at a uniform speed and finally slowing down to stop at some point Q.
Interpret the following graph:
Given below are the speed -time graphs. Match them with their corresponding motions :
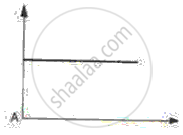 |
(a) Uniformity retared motion |
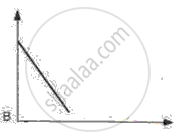 |
(b) Non-uniformity acceleration |
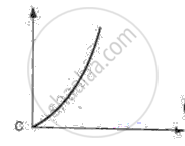 |
(c) Non-uniform motion |
 |
(d) uniform motion |
Figure shows the velocity-time graphs for two objects A and B moving in same direction . Which object has the greater a cceleration?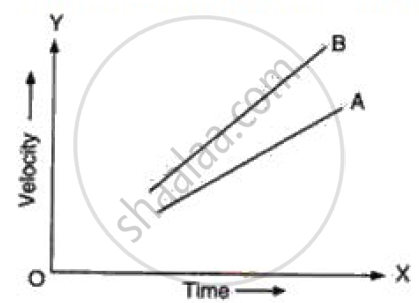
Figure shows the distance-time graph of three students A, B and C. On the basis of the graph, answer the following :
Which of the three is traveling the fastest?
Figure shows the distance-time graph of three students A, B and C. On the basis of the graph, answer the following :
How far did B travel between the time he passed C and A?
