Advertisements
Advertisements
प्रश्न
Given on th e side are a few speed - time graphs for various objects moving along a stra ight line. Refer below figure. (a), (b), (c) and (d).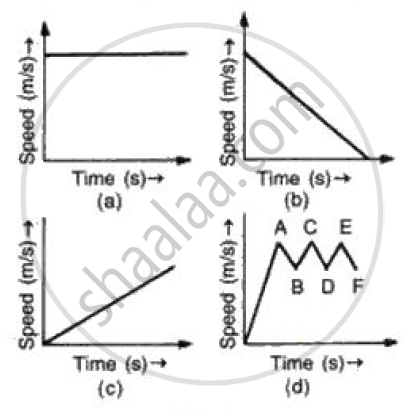
Which of these graphs represent
(a) Uni form motion
(b) Motion with speed increasing
(c) Motion with speed decreasing and
(d) Motion with speed oscillating.?
Advertisements
उत्तर
(i) In speed time graph uniform motion is given by a straight line parallel to x axis so figure (a) denotes the uniform motion.
(ii) In speed time graph motion with increasing speed is shown by straight line with positive slope so figure (c) denotes the motion with speed increasing.
(iii) In speed time graph motion with decreasing speed is shown by straight line with negative slope so figure {b) denotes the motion with speed decreasing.
(iv) In speed time graph motion with oscillating speed is shown by zigzag line so figure {d) denotes the motion with speed oscillating.
APPEARS IN
संबंधित प्रश्न
What conclusion can you draw about the acceleration of a body from the speed-time graph shown below .
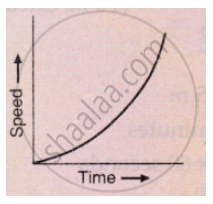
Diagram shows a velocity – time graph for a car starting from rest. The graph has three sections AB, BC and CD.
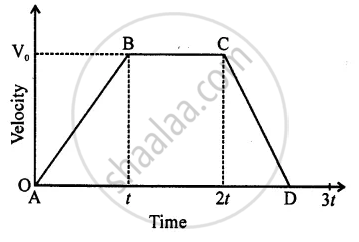
Compare the distance travelled in section BC with the distance travelled in section AB.
Diagram shows a velocity – time graph for a car starting from rest. The graph has three sections AB, BC, and CD.
In which section, car has a zero acceleration?
Diagram shows a velocity – time graph for a car starting from rest. The graph has three sections AB, BC, and CD.
Is the magnitude of acceleration higher or lower than that of retardation? Give a reason.
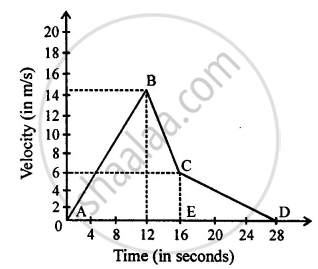
From the velocity – time graph given below, calculate Distance covered in the region ABCE.
How will you use a speed-time graph to find whether the acceleration of the body is uniform or not?
Draw the following graph:
Speed versus time for a non-uniform acceleration.
Its time-displacement graph is a straight line.
Draw velocity-time graph to show:
Zero acceleration
Write a sentence to explain the shape of graph.
The velocity-displacement graph describing the motion of a bicycle is shown in the figure.

The acceleration-displacement graph of the bicycle's motion is best described by:
