Advertisements
Advertisements
प्रश्न
Derive the following equation of motion by the graphical method : v2 = u2 + 2as, where the symbols have their usual meanings.
Advertisements
उत्तर
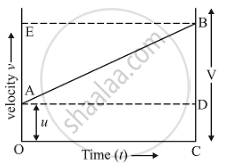
In the given figure, the distance travelled (s) by a body in time (t) is given by the area of the figure OABC which is a trapezium.
Distance travelld = Area of the trapezium OABC
So, Area of trapezium OABC,
= `"(Sum of parallel sides)(Height)"/2`
=`"(OA+CB)(OC)"/2`
Now, (OA + CB) = u + v and (OC) = t.
Putting these values in the above relation, we get:
`s = ((u+v)/2)t` ....(1)
Eliminate t from the above equation. This can be done by obtaining the value of t from the first equation of motion.
v = u + at
So,
`t = "v-u"/a`
Now, put this value of t in equation (1), we get:
`s = (((u+v)(v-u))/(2a))`
On further simplification,
2as = v2 – u2
Finally the third equation of motion.
`v^2 = u^2 + 2as`
where
(s) - Displacement
(u) - Initial velocity
(a) - Acceleration
(v) - Final velocity
(t) - Time taken
APPEARS IN
संबंधित प्रश्न
What is the quantity which is measured by the area occupied below the velocity-time graph?
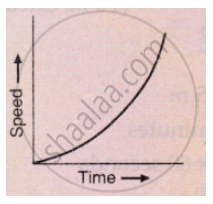
What conclusion can you draw about the acceleration of a body from the speed-time graph shown below .
A body with an initial velocity x moves with a uniform acceleration y. Plot its velocity-time graph.
Draw a displacement-time graph for a boy going to school with uniform velocity.
Diagram shows a velocity – time graph for a car starting from rest. The graph has three sections AB, BC and CD.

Compare the distance travelled in section BC with the distance travelled in section AB.
Represent the location of an object described as at 15 m, 45o west of north, on a graph paper.
Draw the speed-time graph of a body starting from some point P, gradually picking up speed, then running at a uniform speed and finally slowing down to stop at some point Q.
Derive the equation
S = ut+ `1/2` at2
Using a speed- time graph
A straight line parallel to the x-axis in the velocity-time graph represents the object moving in ______.
The area of the velocity-time graph gives the displacement of the body.
