Advertisements
Advertisements
प्रश्न
Draw distance-time graph to show:
Increasing velocity
Advertisements
उत्तर
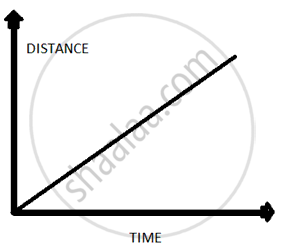
As slope of a distance time graph indicates velocity so a increasing velocity means a straight line having a positive slope with time axis.
APPEARS IN
संबंधित प्रश्न
The velocity-time graph for part of a train journey is a horizontal straight line. What does this tell you about its acceleration ?
Multiple choice Question. Select the correct option.
In the velocity-time graph, the acceleration is
Multiple choice Question. Select the correct option.
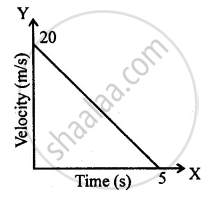
The distance covered in the adjoining velocity-time graph is :
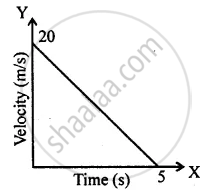
Diagram is given below shows velocity – time graph of car P and Q, starting from the same place and in the same direction. Calculate which car is ahead after 10 s and by how much?

Draw the following graph:
Speed versus time for a non-uniform acceleration.
Interpret the following graph:
Draw velocity-time graph to show:
Acceleration
Write a sentence to explain the shape of graph.
Interpret the following graph: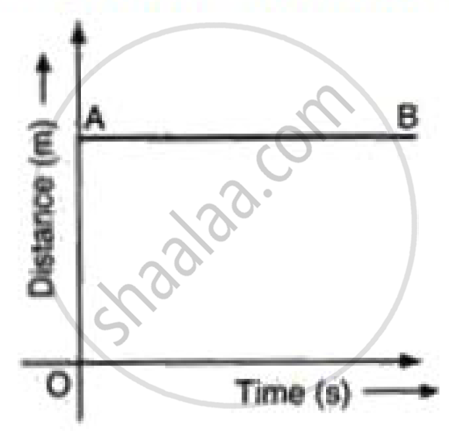
The slope of the speed–time graph gives ______.
The velocity-displacement graph describing the motion of a bicycle is shown in the figure.

The acceleration-displacement graph of the bicycle's motion is best described by:
