Advertisements
Advertisements
प्रश्न
Draw velocity-time graph to show:
Acceleration
Write a sentence to explain the shape of graph.
Advertisements
उत्तर
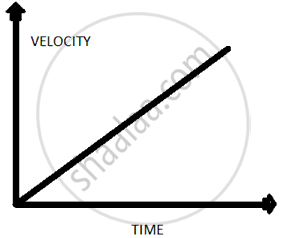
Acceleration is represented by a line on a velocity time graph with a positive slope with time axis.
APPEARS IN
संबंधित प्रश्न
A body with an initial velocity x moves with a uniform acceleration y. Plot its velocity-time graph.
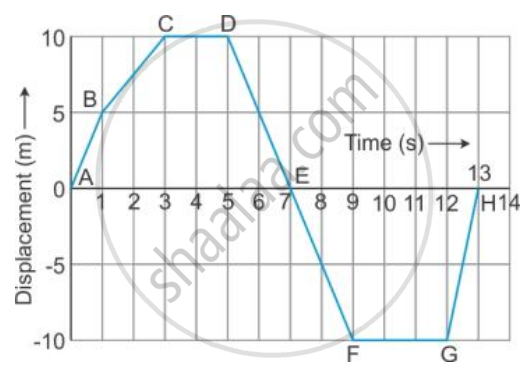
From the displacement-time graph of a cyclist given below in the Figure, find The time after which he reaches the starting point .
Multiple choice Question. Select the correct option.
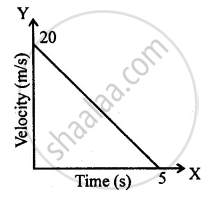
In the velocity-time graph, the acceleration is
From the velocity – time graph given below, calculate Average velocity in region CED.

The area under a speed-time graph in a given intervals gives the total distance covered by a body irrespective of its motion being uniform or non-uniform.
Draw the following graph:
Speed versus time for a non-uniform acceleration.
Draw the following graph:
Distance versus time for a body at rest.
The slope of the speed–time graph gives ______.
From the v-t graph, ______ can be calculated.
If the velocity-time graph has the shape AMB, what would be the shape of the corresponding acceleration-time graph?

