Advertisements
Advertisements
प्रश्न
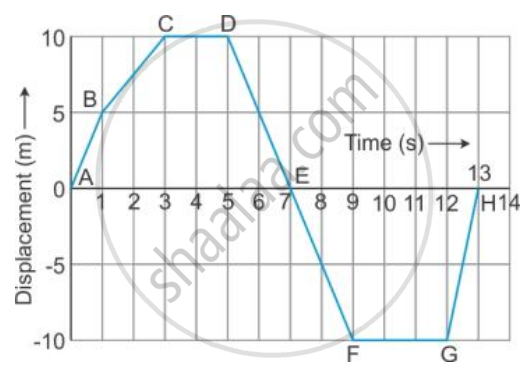
From the displacement-time graph of a cyclist given below in the Figure, find The time after which he reaches the starting point .
Advertisements
उत्तर
The starting point is where displacement = 0 m.
Looking at the graph:
The cyclist starts at point A (0 m at 0 s).
He returns to 0 m at point E at 7 s.
Again, he crosses 0 m at point H at 13 s.
The cyclist reaches the starting point (displacement = 0) at 7 seconds and 13 seconds.
So the first time he returns to the starting point is 7 seconds later.
APPEARS IN
संबंधित प्रश्न
What does the area of an acceleration – time graph represent?
Name the physical quantity which is equal to the area under speed-time graph.
What can you conclude if the speed-time graph of a body is a straight line sloping upwards and not passing through the origin?
Figure shows displacement- time graph of two objects A and B moving in a stra ight line. Which object is moving fa ster?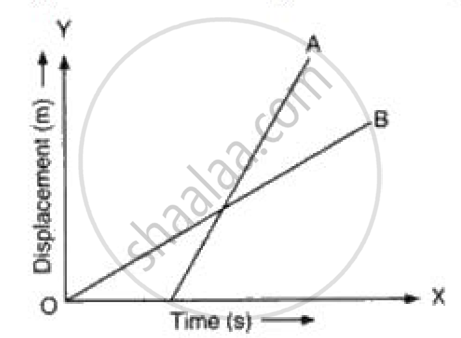
Its time-displacement graph is a straight line.
Draw distance-time graph to show:
Increasing velocity
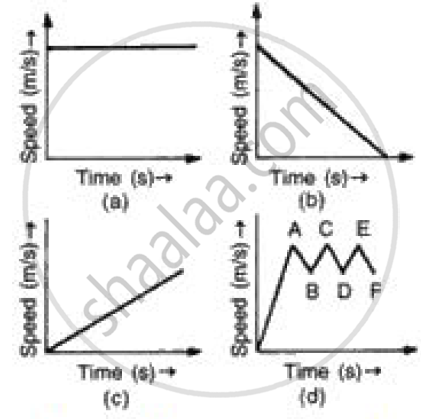
(i) In speed time graph uniform motion is given by a straight line parallel to x axis so figure (a) denotes the uniform motion.
(ii) In speed time graph motion with increasing speed is shown by straight line with positive slope so figure (c) denotes the motion with speed increasing.
(iii) In speed time graph motion with decreasing speed is shown by straight line with negative slope so figure (b) denotes the motion with speed decreasing.
(iv) In speed time graph motion with oscillating speed is shown by zigzag line so figure {d) denotes the motion with speed oscillating.
The area under the v-t graph represents a physical quantity that has the unit.
The area of the velocity-time graph gives the displacement of the body.
If the velocity-time graph has the shape AMB, what would be the shape of the corresponding acceleration-time graph?

