Advertisements
Advertisements
प्रश्न
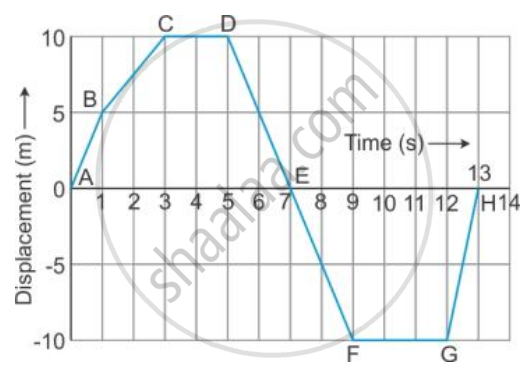
From the displacement-time graph of a cyclist given below in the Figure, find The time after which he reaches the starting point .
Advertisements
उत्तर
The starting point is where displacement = 0 m.
Looking at the graph:
The cyclist starts at point A (0 m at 0 s).
He returns to 0 m at point E at 7 s.
Again, he crosses 0 m at point H at 13 s.
The cyclist reaches the starting point (displacement = 0) at 7 seconds and 13 seconds.
So the first time he returns to the starting point is 7 seconds later.
APPEARS IN
संबंधित प्रश्न
The speed-time graph of an ascending passenger lift is given alongside. What is the acceleration of the lift:
(1) during the first two seconds ?
(2) between second and tenth second ?
(3) during the last two seconds ?
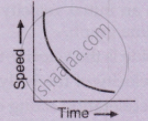
What type of motion is represented by the following graph ?
Multiple choice Question. Select the correct option.
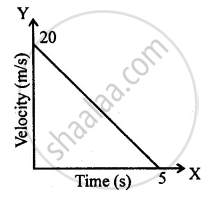
In the velocity-time graph, the acceleration is
Draw the following graph:
Speed versus time for a non-uniform acceleration.
Draw the following graph:
Speed versus time for a fluctuating speed.
Draw the following graph:
Speed versus time for a uniformly retarded motion.
Figure shows the distance-time graph of three students A, B and C. On the basis of the graph, answer the following :
Which of the three is traveling the fastest?
Saphira moves at a constant speed in the same direction. Rephrase the same sentence in fewer words using concepts related to motion.
From the v-t graph, ______ can be calculated.
The area of the velocity-time graph gives the displacement of the body.
