Advertisements
Advertisements
प्रश्न
Draw the distance-time graphs of the bodies P and Q starting from rest, moving with uniform speeds with P moving faster than Q.
Advertisements
उत्तर

APPEARS IN
संबंधित प्रश्न
What is the quantity which is measured by the area occupied below the velocity-time graph?
What can you say about the motion of a body if:
its displacement-time graph is a straight line ?
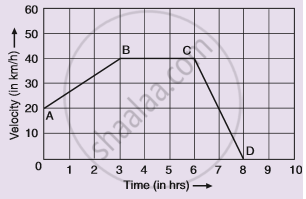
Given alongside is the velocity-time graph for a moving body :
Find :
(i) Velocity of the body at point C.
(ii) Acceleration acting on the body between A and B.
(iii) Acceleration acting on the body between B and C.
Three speed-time graphs are given below :
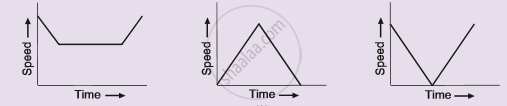
Which graph represents the case of:
(i) a cricket ball thrown vertically upwards and returning to the hands of the thrower ?
(ii) a trolley decelerating to a constant speed and then accelerating uniformly ?
Represent the location of an object described as at 15 m, 45o west of north, on a graph paper.
Which of the following graphs represents a motion with negative acceleration?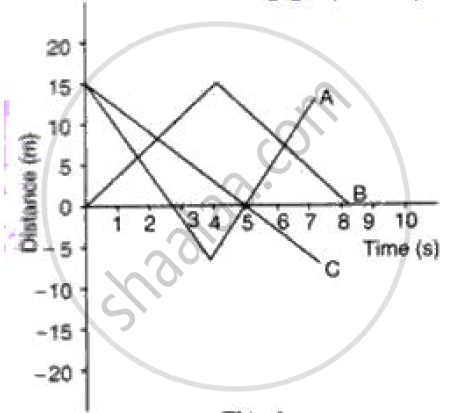
Figure shows displacement- time graph of two objects A and B moving in a stra ight line. Which object is moving fa ster?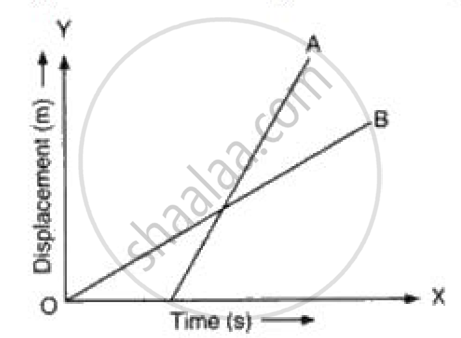
Draw velocity-time graph to show:
Deceleration
Write a sentence to explain the shape of graph.
Which of the following can determine the acceleration of a moving object.
The velocity-displacement graph describing the motion of a bicycle is shown in the figure.

The acceleration-displacement graph of the bicycle's motion is best described by:
