Advertisements
Advertisements
Question
Draw the distance-time graphs of the bodies P and Q starting from rest, moving with uniform speeds with P moving faster than Q.
Advertisements
Solution

APPEARS IN
RELATED QUESTIONS
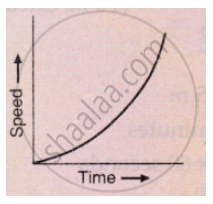
What conclusion can you draw about the acceleration of a body from the speed-time graph shown below .
A car of mass 1000 kg is moving with a velocity of 10 m s−1. If the velocity-time graph for this car is a horizontal line parallel to the time axis, then the velocity of car at the end of 25 s will be :
What does the slope of velocity-time graph represent?
Represent the position of a body described as at 15 m, 30o north of west, on a graph paper.
Given on th e side are a few speed - time graphs for various objects moving along a stra ight line. Refer below figure. (a), (b), (c) and (d).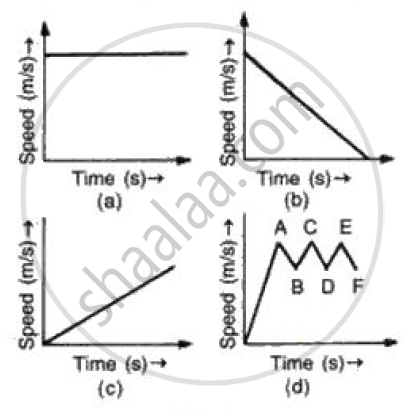
Which of these graphs represent
(a) Uni form motion
(b) Motion with speed increasing
(c) Motion with speed decreasing and
(d) Motion with speed oscillating.?
Interpret the following graph:
Draw distance-time graph to show:
Decreasing velocity
Derive the equation
S = ut+ `1/2` at2
Using a speed- time graph
Slope of the velocity-time graph gives ______.
The given graph shows the variation of velocity (v) with position (x) for a particle moving along a straight line
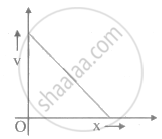
Which of the following graph shows the variation of acceleration (a) with position (x)?
