Advertisements
Advertisements
Question
Draw distance-time graph to show:
Decreasing velocity
Advertisements
Solution

As slope of this line is negative so this represent decreasing velocity.
APPEARS IN
RELATED QUESTIONS
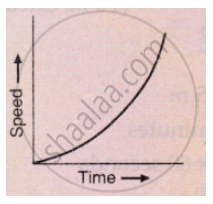
What conclusion can you draw about the acceleration of a body from the speed-time graph shown below .
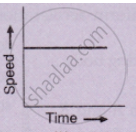
What type of motion is represented by the following graph ?
What does the slope of velocity-time graph represent?
Which of the following graphs represents a motion with negative acceleration?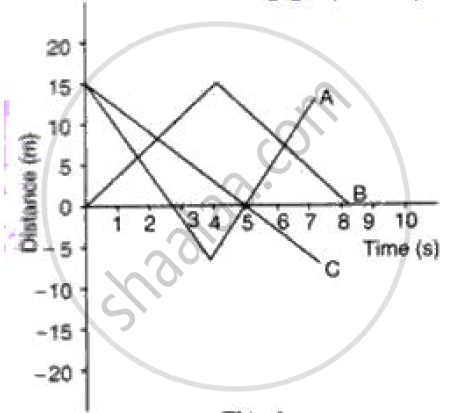
What can you say about the motion of a body if:
Its time-velocity graph is a straight line
Interpret the following graph: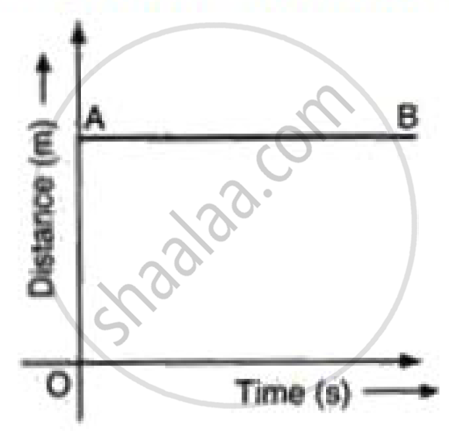
Draw the distance-time graphs of the bodies P and Q starting from rest, moving with uniform speeds with P moving faster than Q.
Figure shows the distance-time graph of three students A, B and C. On the basis of the graph, answer the following :
Which of the three is traveling the fastest?
State whether true or false. If false, correct the statement.
The velocity – time graph of a particle falling freely under gravity would be a straight line parallel to the x axis.
The area of the velocity-time graph gives the displacement of the body.
