Advertisements
Advertisements
Question
Which of the following graphs represents a motion with negative acceleration?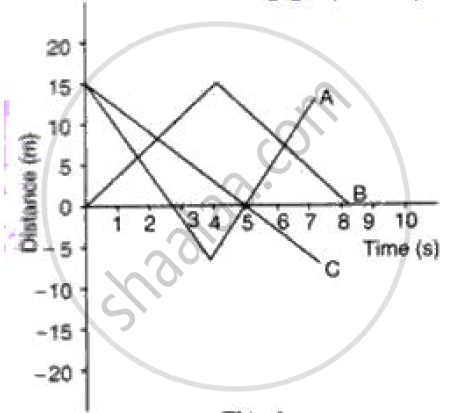
Advertisements
Solution
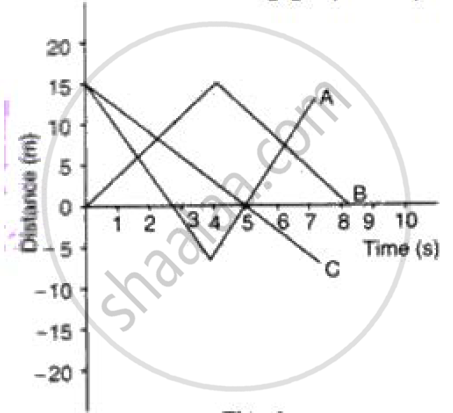
Graph (c) represents a motion with negative acceleration.
APPEARS IN
RELATED QUESTIONS
The velocity-time graph for part of a train journey is a horizontal straight line. What does this tell you about the trains velocity.
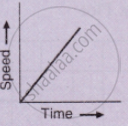
What type of motion is represented by the following graph ?
A car of mass 1000 kg is moving with a velocity of 10 m s−1. If the velocity-time graph for this car is a horizontal line parallel to the time axis, then the velocity of car at the end of 25 s will be :
Draw velocity – time graph for the following situation:
When a body is moving with variable velocity, but uniform acceleration.
From the velocity – time graph given below, calculate Distance covered in the region ABCE.
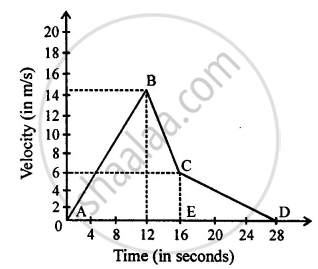
Interpret the following graph: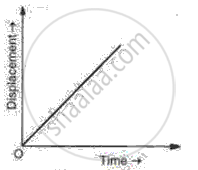
Figure shows displacement- time graph of two objects A and B moving in a stra ight line. Which object is moving fa ster?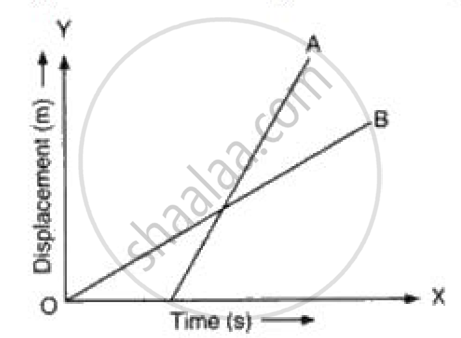
Sketch the shape of the velocity-time graph for a body moving with:
Uniformly velocity
The slope of the speed–time graph gives ______.
Slope of the velocity-time graph gives ______.
