Advertisements
Advertisements
Question
Diagram shows a velocity – time graph for a car starting from rest. The graph has three sections AB, BC, and CD.
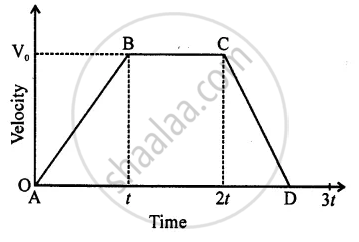
Is the magnitude of acceleration higher or lower than that of retardation? Give a reason.
Advertisements
Solution
Acceleration = slope of AB = `"Bt"/"At"="v"_0/"t"` ......(i)
Retardation = slope of CD = `"v"_0/(1/2"t")=2 "v"_0/"t"` ..........(ii)
∵ Magnitude of retardation is twice the magnitude of acceleration.
∴ Magnitude of acceleration is lower.
APPEARS IN
RELATED QUESTIONS
What can you say about the motion of a body if:
its velocity-time graph is a straight line ?
What does the slope of velocity-time graph represent?
Draw displacement – time graph for the following situation:
When a body is stationary.
From the velocity – time graph given below, calculate Distance covered in the region ABCE.
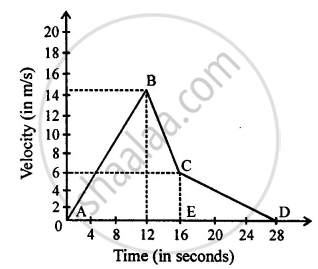
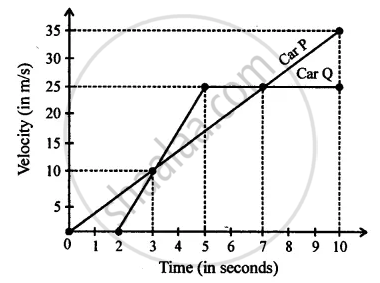
Diagram is given below shows velocity – time graph of car P and Q, starting from the same place and in the same direction. Calculate at what time intervals both cars have the same velocity?
Draw distance-time graph to show:
Increasing velocity
Draw velocity-time graph to show:
Deceleration
Write a sentence to explain the shape of graph.
What does the slope of velocity-time graph represent?
Figure shows the distance-time graph of three students A, B and C. On the basis of the graph, answer the following :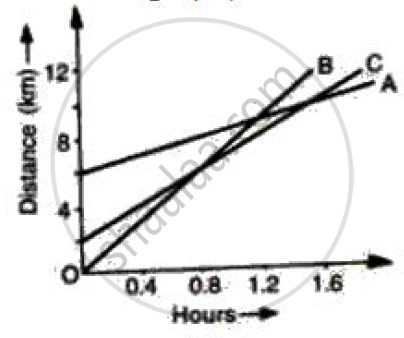
Will the three ever meet at any point on the road?
If the velocity-time graph has the shape AMB, what would be the shape of the corresponding acceleration-time graph?

