Advertisements
Advertisements
Question
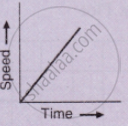
Diagram shows a velocity – time graph for a car starting from rest. The graph has three sections AB, BC, and CD.

In which section, car has a zero acceleration?
Advertisements
Solution
Car has zero acceleration in section BC because there is no change in velocity from B to C.
APPEARS IN
RELATED QUESTIONS
A body is moving uniformly in a straight line with a velocity of 5 m/s. Find graphically the distance covered by it in 5 seconds.
What type of motion is represented by the following graph ?
From the velocity – time graph given below, calculate Average velocity in region CED.

Name the physical quantity which is equal to the area under speed-time graph.
How does the slope of a speed-time graph give the acceleration of a body moving along a straight line?
What can you say about the nature of motion of a body of its displacement-time graph is:
A straight line inclined to the time axis with an acute angle?
Draw velocity-time graph to show:
Zero acceleration
Write a sentence to explain the shape of graph.
Draw the distance-time graphs of the bodies P and Q starting from rest, moving with uniform speeds with P moving faster than Q.
Figure shows the distance-time graph of three students A, B and C. On the basis of the graph, answer the following :
Will the three ever meet at any point on the road?
State whether true or false. If false, correct the statement.
The velocity – time graph of a particle falling freely under gravity would be a straight line parallel to the x axis.
