Advertisements
Advertisements
Question
Diagram shows a velocity – time graph for a car starting from rest. The graph has three sections AB, BC and CD.

Compare the distance travelled in section BC with the distance travelled in section AB.
Advertisements
Solution
`"Distance travelled in part BC"/"Distance travelled in part AB"=("v"_0xx"t")/(1/2xx"t"xx"v"_0)=2/1=2:1`
APPEARS IN
RELATED QUESTIONS
What is the quantity which is measured by the area occupied below the velocity-time graph?
Show by means of graphical method that: v = u + at, where the symbols have their usual meanings.
From the diagram given below, calculate distance covered by body.
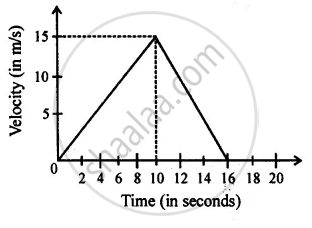
Diagram is given below shows velocity – time graph of car P and Q, starting from the same place and in the same direction. Calculate at what time intervals both cars have the same velocity?

Interpret the following graph:
What does the slope of velocity-time graph represent?
Figure shows the velocity-time graphs for two objects A and B moving in same direction . Which object has the greater a cceleration?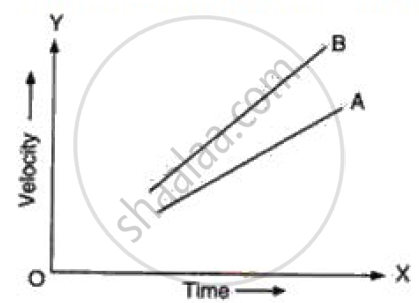
Draw the distance-time graphs of the bodies P and Q starting from rest, moving with uniform speeds with P moving faster than Q.
The area under the v-t graph represents a physical quantity that has the unit.
Which of the following can determine the acceleration of a moving object.
