Advertisements
Advertisements
Question
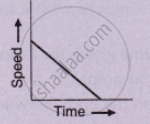
Draw velocity-time graph to show:
Deceleration
Write a sentence to explain the shape of graph.
Advertisements
Solution

Deceleration is represented by a straight line having a negative slope with time axis.
APPEARS IN
RELATED QUESTIONS
What can you say about the motion of a body if its speed-time graph is a straight line parallel to the time axis ?
What type of motion is represented by the following graph ?
Define speed. What is its S.I. unit?
Multiple choice Question. Select the correct option.
A graph is a straight line parallel to the time axis in a distance-time graph. From the graph, it implies:
Represent the position of a body described as at 15 m, 30o north of west, on a graph paper.
Which of the following graphs represents a motion with negative acceleration?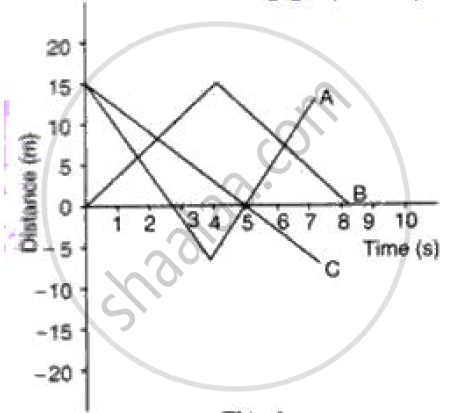
Figure shows displacement- time graph of two objects A and B moving in a stra ight line. Which object is moving fa ster?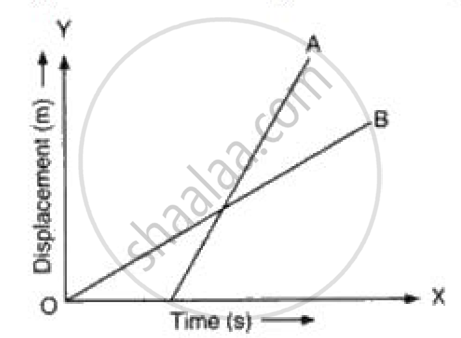
Its time-displacement graph is a straight line.
Figure shows the distance-time graph of three students A, B and C. On the basis of the graph, answer the following :
When B meets A, where is C?
An object is moving in a positive direction with positive acceleration. The velocity-time graph with constant acceleration which represents the above situation is:
