Advertisements
Advertisements
प्रश्न
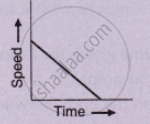
Draw velocity-time graph to show:
Deceleration
Write a sentence to explain the shape of graph.
Advertisements
उत्तर

Deceleration is represented by a straight line having a negative slope with time axis.
APPEARS IN
संबंधित प्रश्न
What type of motion is represented by the following graph ?
What does the slope of velocity-time graph represent?
From the displacement-time graph of a cyclist given below in the Figure, find The time after which he reaches the starting point .
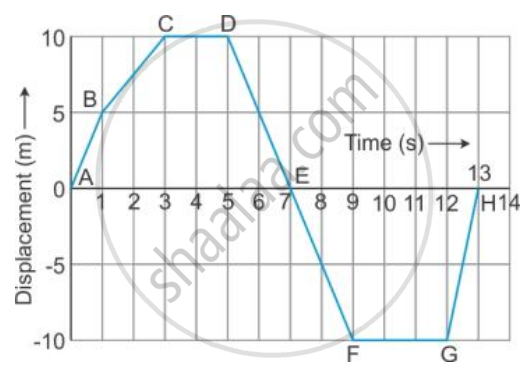
Diagram shows a velocity – time graph for a car starting from rest. The graph has three sections AB, BC and CD.

From a study of this graph, state how the distance travelled in any section is determined.
Draw the following graph:
Speed versus time for a stepped motion
Draw the following graph:
Speed versus time for a uniformly retarded motion.
What can you say about the nature of motion of a body of its displacement-time graph is:
A straight line inclined to the time axis with an acute angle?
Figure shows the velocity-time graphs for two objects A and B moving in same direction . Which object has the greater a cceleration?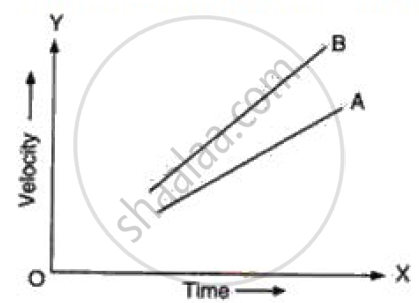
Saphira moves at a constant speed in the same direction. Rephrase the same sentence in fewer words using concepts related to motion.
State whether true or false. If false, correct the statement.
The velocity – time graph of a particle falling freely under gravity would be a straight line parallel to the x axis.
