Advertisements
Advertisements
प्रश्न
Diagram shows a velocity – time graph for a car starting from rest. The graph has three sections AB, BC, and CD.

Is the magnitude of acceleration higher or lower than that of retardation? Give a reason.
Advertisements
उत्तर
Acceleration = slope of AB = `"Bt"/"At"="v"_0/"t"` ......(i)
Retardation = slope of CD = `"v"_0/(1/2"t")=2 "v"_0/"t"` ..........(ii)
∵ Magnitude of retardation is twice the magnitude of acceleration.
∴ Magnitude of acceleration is lower.
APPEARS IN
संबंधित प्रश्न
Name the two quantities, the slope of whose graph give acceleration.
Show by using the graphical method that: `s=ut+1/2at^2` where the symbols have their usual meanings.
What does the area of an acceleration – time graph represent?
Given on th e side are a few speed - time graphs for various objects moving along a stra ight line. Refer below figure. (a), (b), (c) and (d).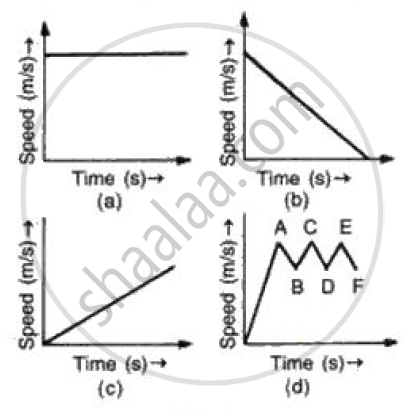
Which of these graphs represent
(a) Uni form motion
(b) Motion with speed increasing
(c) Motion with speed decreasing and
(d) Motion with speed oscillating.?
Draw the following graph:
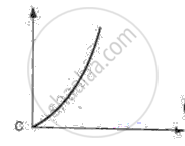
Speed versus time for a non-uniform acceleration.
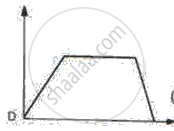
Given below are the speed -time graphs. Match them with their corresponding motions :
 |
(a) Uniformity retared motion |
 |
(b) Non-uniformity acceleration |
 |
(c) Non-uniform motion |
 |
(d) uniform motion |
Interpret the following graph: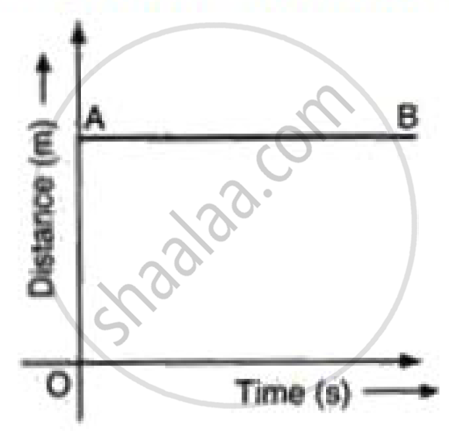
Draw the distance-time graphs of the bodies P and Q starting from rest, moving with uniform speeds with P moving faster than Q.
The area under the v-t graph represents a physical quantity that has the unit.
Slope of the velocity-time graph gives ______.
