Advertisements
Advertisements
Question
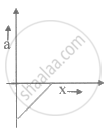
The given graph shows the variation of velocity (v) with position (x) for a particle moving along a straight line
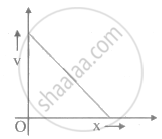
Which of the following graph shows the variation of acceleration (a) with position (x)?
Options
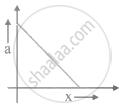
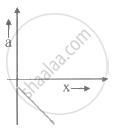
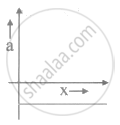
MCQ
Advertisements
Solution
Explanation:
The position of the velocity equation for the given graph is given as,
v = – mx + v0
∴ v = `((-v_0)/x_0) x + v_0` ......(i)
∴ `(dv)/(dt) = ((-v_0)/(x_0)) (dx)/(dt) = ((-v_0)/(x_0))v`
Substituting equation (i), we get,
`(dv)/(dt) = ((- v_0)/(x_0)) [((- v_0)/(x_0))x + v_0]`
∴ a = `((v_0)/(x_0))^2 x - (v_0^2)/(x_0)`
As a result, the acceleration-position graph is a straight line with a positive slope and a negative intercept; that is, graph (A).
shaalaa.com
Is there an error in this question or solution?
