Advertisements
Advertisements
Question
A body at rest is thrown downward from the top of the tower. Draw a distance – time graph of its free fall under gravity during the first 3 seconds. Show your table of values starting t = 0 with an interval of 1 second, (g = 10 ms−2).
Advertisements
Solution
Initial velocity = M = 0
Acceleration = a = +g = 10 ms−2
when t = Is, then distance travelled (S), is given by
S1 = ut + `1/2` at2
S1 = `0(1)+1/2(10)(1)^2`
S1 = 5m
When t = 2s then S2 = ut + `1/2` at2
S2 = `(0)(2)+1/2(10)(2)^2`
S2 = 5(4) = 20 m
When t = 3s, then S3 = ut + `1/2` at2
S3 = `(0)(3)+1/2(10)(3)^2`
S = 5 (9) = 45 m
| Time | 1s | 2s | 3s |
| Distance covered | 5 m | 20 m | 45 m |

APPEARS IN
RELATED QUESTIONS
Draw a velocity-time graph for the free fall of a body under gravity starting from rest. Take g = 10m s-2
What does the area of an acceleration – time graph represent?
Draw displacement – time graph for the following situation:
When a body is stationary.
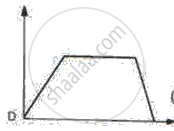
Diagram shows a velocity – time graph for a car starting from rest. The graph has three sections AB, BC, and CD.

In which section, car has a zero acceleration?
How will you use a speed-time graph to find whether the acceleration of the body is uniform or not?
Given on th e side are a few speed - time graphs for various objects moving along a stra ight line. Refer below figure. (a), (b), (c) and (d).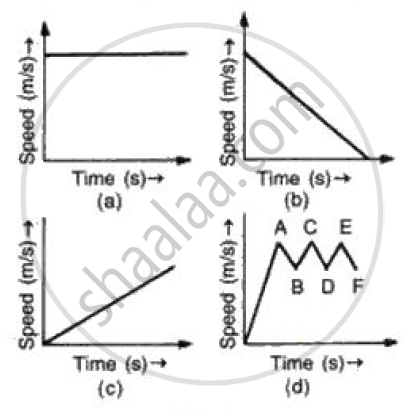
Which of these graphs represent
(a) Uni form motion
(b) Motion with speed increasing
(c) Motion with speed decreasing and
(d) Motion with speed oscillating.?
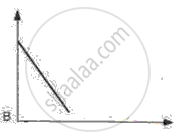
Given below are the speed -time graphs. Match them with their corresponding motions :
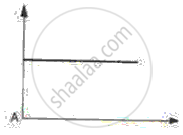 |
(a) Uniformity retared motion |
 |
(b) Non-uniformity acceleration |
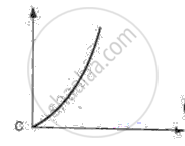 |
(c) Non-uniform motion |
 |
(d) uniform motion |
Figure shows the velocity-time graphs for two objects A and B moving in same direction . Which object has the greater a cceleration?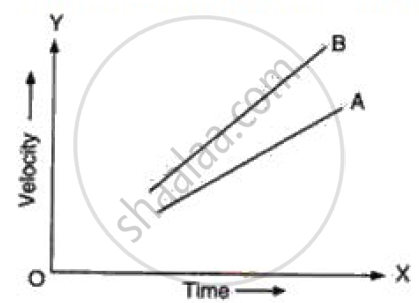
Sketch the shape of the velocity-time graph for a body moving with:
Uniformly velocity
The area under velocity – time graph represents the ______
