Advertisements
Advertisements
प्रश्न
A body at rest is thrown downward from the top of the tower. Draw a distance – time graph of its free fall under gravity during the first 3 seconds. Show your table of values starting t = 0 with an interval of 1 second, (g = 10 ms−2).
Advertisements
उत्तर
Initial velocity = M = 0
Acceleration = a = +g = 10 ms−2
when t = Is, then distance travelled (S), is given by
S1 = ut + `1/2` at2
S1 = `0(1)+1/2(10)(1)^2`
S1 = 5m
When t = 2s then S2 = ut + `1/2` at2
S2 = `(0)(2)+1/2(10)(2)^2`
S2 = 5(4) = 20 m
When t = 3s, then S3 = ut + `1/2` at2
S3 = `(0)(3)+1/2(10)(3)^2`
S = 5 (9) = 45 m
| Time | 1s | 2s | 3s |
| Distance covered | 5 m | 20 m | 45 m |

APPEARS IN
संबंधित प्रश्न
What does the slope of a speed-time graph indicate ?
The velocity-time graph for part of a train journey is a horizontal straight line. What does this tell you about the trains velocity.
Show by means of graphical method that: v = u + at, where the symbols have their usual meanings.
What does the area of an acceleration – time graph represent?
The area under a speed-time graph in a given intervals gives the total distance covered by a body irrespective of its motion being uniform or non-uniform.
Draw the speed-time graph of a body when its initial speed is not zero and the speed increases uniformly with time.
Figure shows the distance-time graph of three students A, B and C. On the basis of the graph, answer the following :
Which of the three is traveling the fastest?
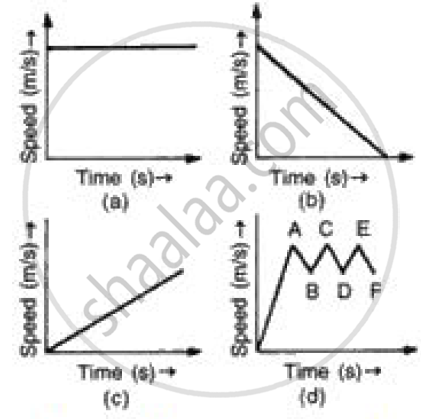
(i) In speed time graph uniform motion is given by a straight line parallel to x axis so figure (a) denotes the uniform motion.
(ii) In speed time graph motion with increasing speed is shown by straight line with positive slope so figure (c) denotes the motion with speed increasing.
(iii) In speed time graph motion with decreasing speed is shown by straight line with negative slope so figure (b) denotes the motion with speed decreasing.
(iv) In speed time graph motion with oscillating speed is shown by zigzag line so figure {d) denotes the motion with speed oscillating.
The area under velocity – time graph represents the ______
The given graph shows the variation of velocity (v) with position (x) for a particle moving along a straight line
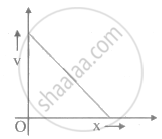
Which of the following graph shows the variation of acceleration (a) with position (x)?
