Advertisements
Advertisements
प्रश्न
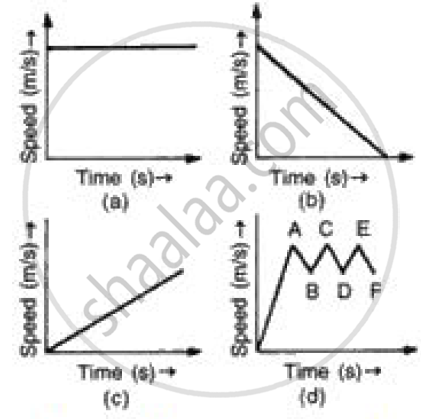
(i) In speed time graph uniform motion is given by a straight line parallel to x axis so figure (a) denotes the uniform motion.
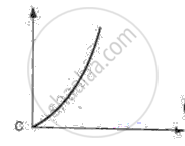
(ii) In speed time graph motion with increasing speed is shown by straight line with positive slope so figure (c) denotes the motion with speed increasing.
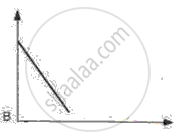
(iii) In speed time graph motion with decreasing speed is shown by straight line with negative slope so figure (b) denotes the motion with speed decreasing.
(iv) In speed time graph motion with oscillating speed is shown by zigzag line so figure {d) denotes the motion with speed oscillating.
Advertisements
उत्तर
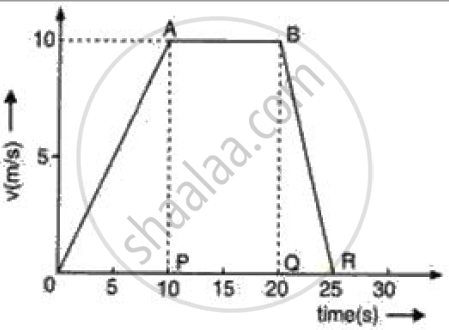
As we know that acceleration is given by the slope of the velocity-time graph so we have to calculate the slope of the graph of each stage of motion,
Acceleration during O to P = (10 - 0)/ (10 - 0) = 1 ms-2
Acceleration during P to Q = (10 - 10)/ (20 - 10) = 0 ms-2
Acceleration during Q to R = (0 - 10) / (25 -20) = - 2 ms-2.
APPEARS IN
संबंधित प्रश्न
Show by means of graphical method that: v = u + at, where the symbols have their usual meanings.
What can you say about the motion of a body if:
its displacement-time graph is a straight line ?
Three speed-time graphs are given below :
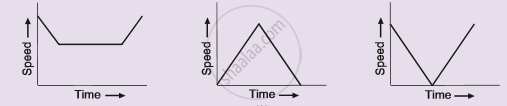
Which graph represents the case of:
(i) a cricket ball thrown vertically upwards and returning to the hands of the thrower ?
(ii) a trolley decelerating to a constant speed and then accelerating uniformly ?
Draw a displacement-time graph for a boy going to school with uniform velocity.
Draw velocity – time graph for the following situation:
When a body is moving with variable velocity, but uniform acceleration.
Draw the following graph:
Speed versus time for a stepped motion
Given below are the speed -time graphs. Match them with their corresponding motions :
 |
(a) Uniformity retared motion |
 |
(b) Non-uniformity acceleration |
 |
(c) Non-uniform motion |
 |
(d) uniform motion |
What does the slope of speed-time graph indicate?
Derive the equation
S = ut+ `1/2` at2
Using a speed- time graph
Figure shows the distance-time graph of three students A, B and C. On the basis of the graph, answer the following :
How far did B travel between the time he passed C and A?
