Advertisements
Advertisements
प्रश्न
Draw a displacement-time graph for a boy going to school with uniform velocity.
Advertisements
उत्तर

APPEARS IN
संबंधित प्रश्न
What does the slope of a displacement-time graph represent?
Multiple choice Question. Select the correct option.
The slope of displacement – time graph represents.
Draw velocity – time graph for the following situation:
When a body, is moving with uniform velocity.
Represent the position of a body described as at 15 m, 30o north of west, on a graph paper.
How does the slope of a speed-time graph give the acceleration of a body moving along a straight line?
Given below are the speed -time graphs. Match them with their corresponding motions :
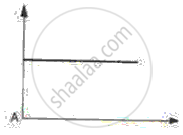 |
(a) Uniformity retared motion |
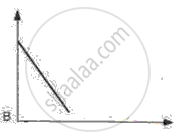 |
(b) Non-uniformity acceleration |
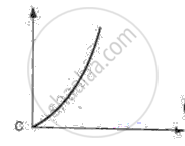 |
(c) Non-uniform motion |
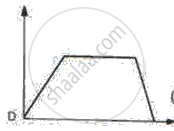 |
(d) uniform motion |
What can you say about the nature of motion of a body of its displacement-time graph is:
A straight line parallel to line axis?
Draw distance-time graph to show:
Increasing velocity
Draw velocity-time graph to show:
Deceleration
Write a sentence to explain the shape of graph.
Slope of the velocity-time graph gives ______.
