Advertisements
Advertisements
प्रश्न
How does the slope of a speed-time graph give the acceleration of a body moving along a straight line?
Advertisements
उत्तर
Slope of a graph is given as rate of change of y coordinates to the x coordinate. In speed time graph speed is on the y axis and time is on the x axis. And we define acceleration as rate of change of speed with respect to time. So slope of a speed time graph gives acceleration.
APPEARS IN
संबंधित प्रश्न
What can you say about the motion of a body if its speed-time graph is a straight line parallel to the time axis ?
The velocity-time graph for part of a train journey is a horizontal straight line. What does this tell you about its acceleration ?
Derive the following equation of motion by the graphical method : v2 = u2 + 2as, where the symbols have their usual meanings.
What does the slope of velocity-time graph represent?
Diagram shows a velocity – time graph for a car starting from rest. The graph has three sections AB, BC, and CD.
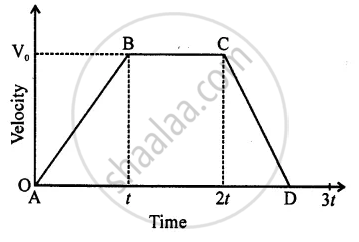
In which section, car has a zero acceleration?
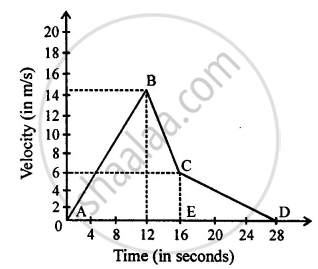
From the velocity – time graph given below, calculate Distance covered in the region ABCE.
The area of the right triangle under a speed-time graph is 500 m, in a time interval of 20 s. What is the speed of the body? Is the motion uniform or non-uniform?
Interpret the following graph: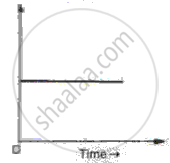
What does the slope of speed-time graph indicate?
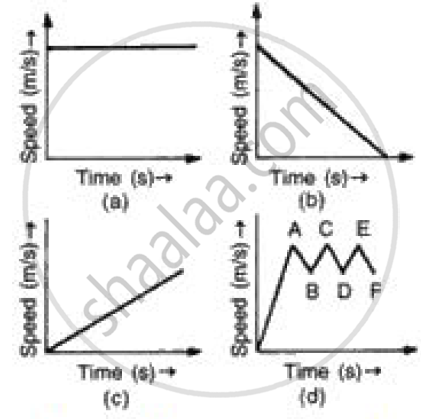
(i) In speed time graph uniform motion is given by a straight line parallel to x axis so figure (a) denotes the uniform motion.
(ii) In speed time graph motion with increasing speed is shown by straight line with positive slope so figure (c) denotes the motion with speed increasing.
(iii) In speed time graph motion with decreasing speed is shown by straight line with negative slope so figure (b) denotes the motion with speed decreasing.
(iv) In speed time graph motion with oscillating speed is shown by zigzag line so figure {d) denotes the motion with speed oscillating.
