Advertisements
Advertisements
प्रश्न
How does the slope of a speed-time graph give the acceleration of a body moving along a straight line?
Advertisements
उत्तर
Slope of a graph is given as rate of change of y coordinates to the x coordinate. In speed time graph speed is on the y axis and time is on the x axis. And we define acceleration as rate of change of speed with respect to time. So slope of a speed time graph gives acceleration.
APPEARS IN
संबंधित प्रश्न
What can you say about the motion of a body if its speed-time graph is a straight line parallel to the time axis ?
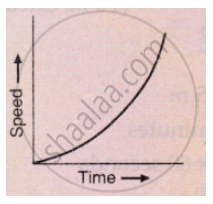
What conclusion can you draw about the acceleration of a body from the speed-time graph shown below .
Name the two quantities, the slope of whose graph give acceleration.
The velocity-time graph for part of a train journey is a horizontal straight line. What does this tell you about its acceleration ?
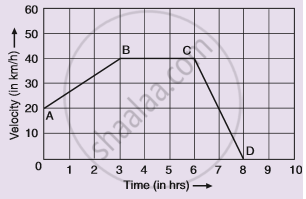
Given alongside is the velocity-time graph for a moving body :
Find :
(i) Velocity of the body at point C.
(ii) Acceleration acting on the body between A and B.
(iii) Acceleration acting on the body between B and C.
What type of motion is represented by the following graph ?
From the velocity – time graph given below, calculate Distance covered in the region ABCE.

Draw the following graph:
Speed versus time for a uniformly retarded motion.
Interpret the following graph:
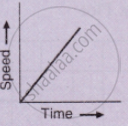
An object is moving in a positive direction with positive acceleration. The velocity-time graph with constant acceleration which represents the above situation is:
