Advertisements
Advertisements
प्रश्न
Draw the following graph:
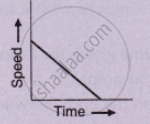
Speed versus time for a uniformly retarded motion.
Advertisements
उत्तर

Spped time graph for a uniformity retarded motion
APPEARS IN
संबंधित प्रश्न
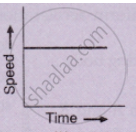
What can you say about the motion of a body if its speed-time graph is a straight line parallel to the time axis ?
What can you say about the motion of a body if:
its displacement-time graph is a straight line ?
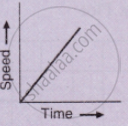
What type of motion is represented by the following graph ?
What type of motion is represented by the following graph ?
What type of motion is represented by the following graph ?
What does the slope of velocity-time graph represent?
What does the area of an acceleration – time graph represent?
Represent the location of an object described as at 15 m, 45o west of north, on a graph paper.
Draw the speed-time graph of a body starting from some point P, gradually picking up speed, then running at a uniform speed and finally slowing down to stop at some point Q.
Draw distance-time graph to show:
Increasing velocity
