Advertisements
Advertisements
प्रश्न
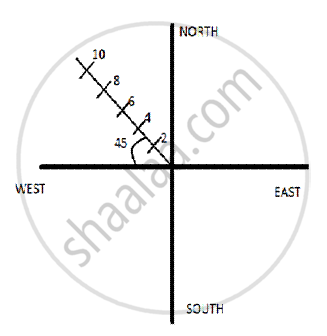
Represent the location of an object described as at 15 m, 45o west of north, on a graph paper.
Advertisements
उत्तर
APPEARS IN
संबंधित प्रश्न
Show by using the graphical method that: `s=ut+1/2at^2` where the symbols have their usual meanings.
What type of motion is represented by the following graph ?
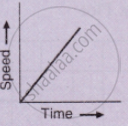
What type of motion is represented by the following graph ?
What does the area of an acceleration – time graph represent?
Diagram shows a velocity – time graph for a car starting from rest. The graph has three sections AB, BC and CD.
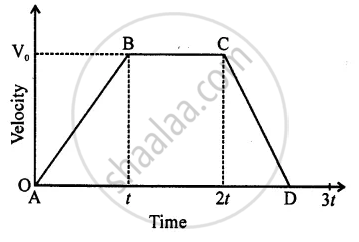
From a study of this graph, state how the distance travelled in any section is determined.
Diagram shows a velocity – time graph for a car starting from rest. The graph has three sections AB, BC, and CD.
Is the magnitude of acceleration higher or lower than that of retardation? Give a reason.
The area of the right triangle under a speed-time graph is 500 m, in a time interval of 20 s. What is the speed of the body? Is the motion uniform or non-uniform?
Draw the following graph:
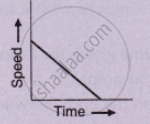
Speed versus time for a uniformly retarded motion.
Figure shows the velocity-time graphs for two objects A and B moving in same direction . Which object has the greater a cceleration?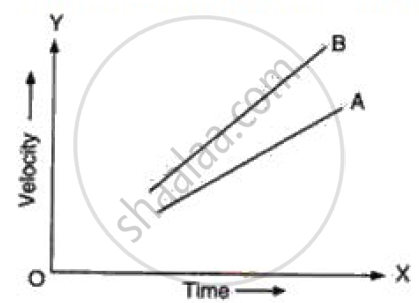
If the velocity-time graph has the shape AMB, what would be the shape of the corresponding acceleration-time graph?

