Advertisements
Advertisements
प्रश्न
Draw the speed-time graph of a body starting from some point P, gradually picking up speed, then running at a uniform speed and finally slowing down to stop at some point Q.
Advertisements
उत्तर

Speed time graph of a body starting from point P gradually picking up speed, then running at a uniform speed and finally slowing down to stop at some point Q
APPEARS IN
संबंधित प्रश्न
A car of mass 1000 kg is moving with a velocity of 10 m s−1. If the velocity-time graph for this car is a horizontal line parallel to the time axis, then the velocity of car at the end of 25 s will be :
Diagram shows a velocity – time graph for a car starting from rest. The graph has three sections AB, BC, and CD.

In which section, car has a zero acceleration?
A body at rest is thrown downward from the top of the tower. Draw a distance – time graph of its free fall under gravity during the first 3 seconds. Show your table of values starting t = 0 with an interval of 1 second, (g = 10 ms−2).
The area of the right triangle under a speed-time graph is 500 m, in a time interval of 20 s. What is the speed of the body? Is the motion uniform or non-uniform?
Given on th e side are a few speed - time graphs for various objects moving along a stra ight line. Refer below figure. (a), (b), (c) and (d).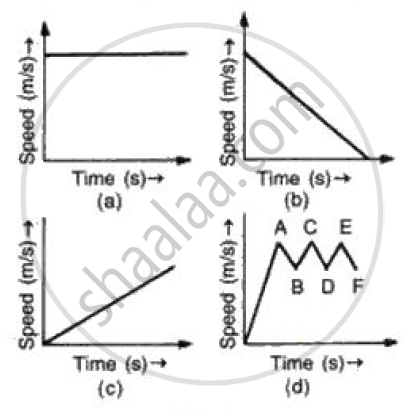
Which of these graphs represent
(a) Uni form motion
(b) Motion with speed increasing
(c) Motion with speed decreasing and
(d) Motion with speed oscillating.?
Its time-displacement graph is a straight line.
Draw distance-time graph to show:
Uniform velocity
What does the slope of velocity-time graph represent?
Sketch the shape of the velocity-time graph for a body moving with:
Uniformly velocity
Figure shows the distance-time graph of three students A, B and C. On the basis of the graph, answer the following :
Which of the three is traveling the fastest?
