Advertisements
Advertisements
Question
Draw the speed-time graph of a body starting from some point P, gradually picking up speed, then running at a uniform speed and finally slowing down to stop at some point Q.
Advertisements
Solution

Speed time graph of a body starting from point P gradually picking up speed, then running at a uniform speed and finally slowing down to stop at some point Q
APPEARS IN
RELATED QUESTIONS
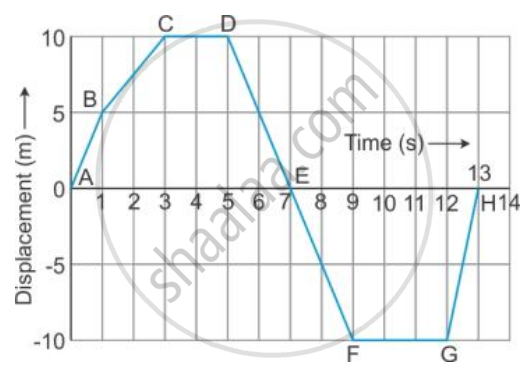
From the displacement-time graph of a cyclist given below in the Figure, find The time after which he reaches the starting point .
Multiple choice Question. Select the correct option.
In the velocity-time graph, the acceleration is
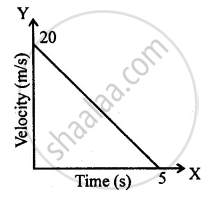
From the velocity – time graph given below, calculate Average velocity in region CED.

Represent the location of an object described as at 15 m, 45o west of north, on a graph paper.
How does the slope of a speed-time graph give the acceleration of a body moving along a straight line?
What can you conclude if the speed-time graph of a body is a curve moving upwards starting from the origin?
Draw distance-time graph to show:
Uniform velocity
Draw velocity-time graph to show:
Deceleration
Write a sentence to explain the shape of graph.
Draw the distance-time graphs of the bodies P and Q starting from rest, moving with uniform speeds with P moving faster than Q.
Figure shows the distance-time graph of three students A, B and C. On the basis of the graph, answer the following :
Which of the three is traveling the fastest?
