Advertisements
Advertisements
Question
Figure shows the distance-time graph of three students A, B and C. On the basis of the graph, answer the following :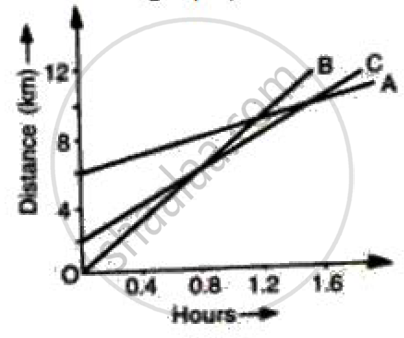
Which of the three is traveling the fastest?
Advertisements
Solution
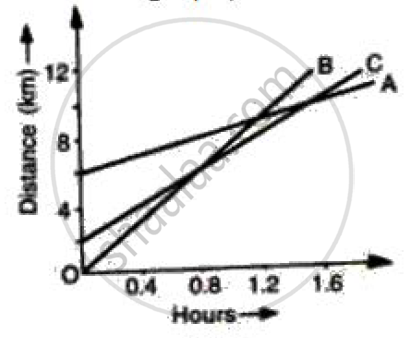
8 is travelling fastest among all the 3 students
APPEARS IN
RELATED QUESTIONS
What is the quantity which is measured by the area occupied below the velocity-time graph?
The velocity-time graph for part of a train journey is a horizontal straight line. What does this tell you about its acceleration ?
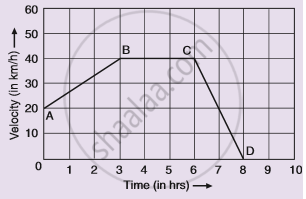
Given alongside is the velocity-time graph for a moving body :
Find :
(i) Velocity of the body at point C.
(ii) Acceleration acting on the body between A and B.
(iii) Acceleration acting on the body between B and C.
Study the speed-time graph of a car given alongside and answer the following questions:
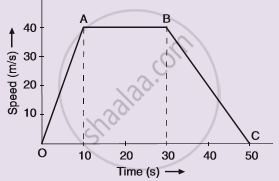
(i) What type of motion is represented by OA ?
(ii) What type of motion is represented by AB ?
(iii) What type of motion is represented by BC ?
(iv) What is the acceleration of car from O to A ?
(v)What is the acceleration of car from A to B ?
(vi) What is the retardation of car from B to C ?
Draw displacement – time graph for the following situation:
When a body is stationary.
Draw velocity – time graph for the following situation:
When a body is moving with variable velocity, but uniform acceleration.
How will you use a speed-time graph to find whether the acceleration of the body is uniform or not?
Draw the speed-time graph of a body when its initial speed is not zero and the speed increases uniformly with time.
Draw the distance-time graphs of the bodies P and Q starting from rest, moving with uniform speeds with P moving faster than Q.
The slope of the speed–time graph gives ______.
