Advertisements
Advertisements
प्रश्न
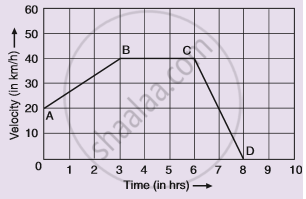
Given alongside is the velocity-time graph for a moving body :
Find :
(i) Velocity of the body at point C.
(ii) Acceleration acting on the body between A and B.
(iii) Acceleration acting on the body between B and C.
Advertisements
उत्तर
(i) BC represents uniform velocity. So velocity of the body at point C is 40 km
(ii) Acceleration = Slope of line AB
= `((40-20))/((3-0)) (km)/(hr^2)`
= 6.66 `"km/hr"^2`
(iii) BC represents uniform velocity, so, acceleration acting on the body is zero.
APPEARS IN
संबंधित प्रश्न
What can you say about the motion of a body if its speed-time graph is a straight line parallel to the time axis ?
Show by using the graphical method that: `s=ut+1/2at^2` where the symbols have their usual meanings.
A body with an initial velocity x moves with a uniform acceleration y. Plot its velocity-time graph.
A body is moving uniformly in a straight line with a velocity of 5 m/s. Find graphically the distance covered by it in 5 seconds.
From the velocity – time graph given below, calculate Distance covered in the region ABCE.

Diagram is given below shows velocity – time graph of car P and Q, starting from the same place and in the same direction. Calculate which car is ahead after 10 s and by how much?

Draw velocity-time graph to show:
Zero acceleration
Write a sentence to explain the shape of graph.
Sketch the shape of the velocity-time graph for a body moving with:
Uniformly velocity
The slope of the speed–time graph gives ______.
State whether true or false. If false, correct the statement.
If the velocity – time graph of a particle is a straight line inclined to X-axis then its displacement – time graph will be a straight line.
