Advertisements
Advertisements
प्रश्न
Show by means of graphical method that: v = u + at, where the symbols have their usual meanings.
Advertisements
उत्तर
Consider the velocity-time graph of a body shown in figure.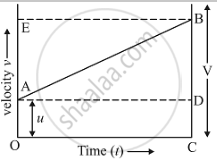
The body has an initial velocity (u) at a point A and then, its velocity changes at a uniform rate from A to B in time, (t). In other words, there is a uniform acceleration (a) from A to B, and after time (t) its final velocity becomes (v) which is equal to BC in the graph. The time (t) is represented by OC. To complete the figure, we draw the perpendicular CB from point C, and draw AD parallel to OC. BE is the perpendicular from point B to OE.
And, final velocity of the body, (v) = BC …… (2)
But from the graph BC = BD + DC
Therefore, v = BD + DC ……(3)
Again DC = OA
So, v = BD + OA
Now, from equation (1),
So, v = BD + u ......(4)
We should find out the value of the slope of a velocity-time graph which is equal to the acceleration,
Thus, Acceleration,
`a = "BD"/"AD"`
But AD = OC = t, so putting t in place of AD in the above relation, we get,
`a = "BD"/t`
So, BD = at
Now, putting this value of BD in equation (4), we get the 1st equation of motion-:
`v = u + at`
where,
(a) - Acceleration
(v) - Final velocity
(u) - Initial velocity
(t) - Time taken
APPEARS IN
संबंधित प्रश्न
What is the quantity which is measured by the area occupied below the velocity-time graph?
What can you say about the motion of a body if:
its velocity-time graph is a straight line ?
What type of motion is represented by the following graph ?
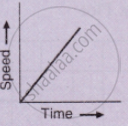
Draw velocity – time graph for the following situation:
When a body, is moving with uniform velocity.
Represent the position of a body described as at 15 m, 30o north of west, on a graph paper.
The area under a speed-time graph in a given intervals gives the total distance covered by a body irrespective of its motion being uniform or non-uniform.
How does the slope of a speed-time graph give the acceleration of a body moving along a straight line?
Given on th e side are a few speed - time graphs for various objects moving along a stra ight line. Refer below figure. (a), (b), (c) and (d).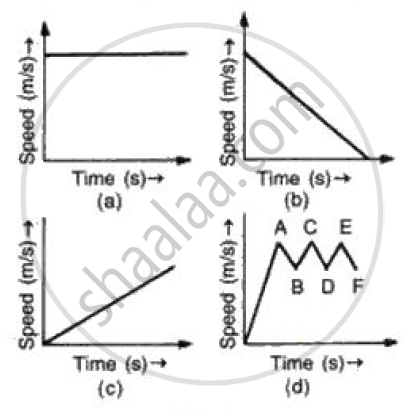
Which of these graphs represent
(a) Uni form motion
(b) Motion with speed increasing
(c) Motion with speed decreasing and
(d) Motion with speed oscillating.?
What can you say about the nature of motion of a body of its displacement-time graph is:
A straight line inclined to the time axis with an acute angle?
If the velocity-time graph has the shape AMB, what would be the shape of the corresponding acceleration-time graph?

