Advertisements
Advertisements
प्रश्न
Draw velocity – time graph for the following situation:
When a body, is moving with uniform velocity.
Advertisements
उत्तर
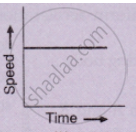
Following is the velocity-time graph:
When a body is moving with uniform velocity: Then a velocity-time graph is AB is a straight line parallel to the time axis.

APPEARS IN
संबंधित प्रश्न
What does the slope of a speed-time graph indicate ?
What can you say about the motion of a body if:
its velocity-time graph is a straight line ?
What type of motion is represented by the following graph ?
From the velocity – time graph given below, calculate Distance covered in the region ABCE.

Diagram is given below shows velocity – time graph of car P and Q, starting from the same place and in the same direction. Calculate which car is ahead after 10 s and by how much?

How does the slope of a speed-time graph give the acceleration of a body moving along a straight line?
Sketch the shape of the velocity-time graph for a body moving with:
Uniformly velocity
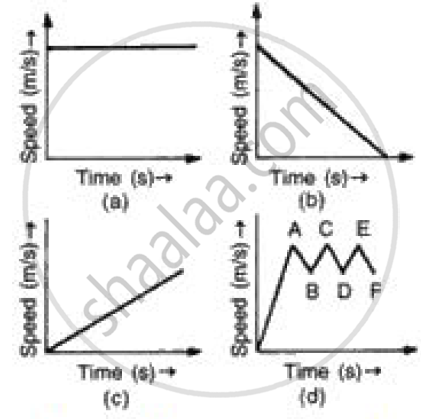
(i) In speed time graph uniform motion is given by a straight line parallel to x axis so figure (a) denotes the uniform motion.
(ii) In speed time graph motion with increasing speed is shown by straight line with positive slope so figure (c) denotes the motion with speed increasing.
(iii) In speed time graph motion with decreasing speed is shown by straight line with negative slope so figure (b) denotes the motion with speed decreasing.
(iv) In speed time graph motion with oscillating speed is shown by zigzag line so figure {d) denotes the motion with speed oscillating.
State whether true or false. If false, correct the statement.
If the velocity – time graph of a particle is a straight line inclined to X-axis then its displacement – time graph will be a straight line.
Which of the following can determine the acceleration of a moving object.
