Advertisements
Advertisements
प्रश्न
Draw displacement – time graph for the following situation:
When a body is moving with variable velocity.
Advertisements
उत्तर
Displacement – time graph When a body is moving with variable velocity.

APPEARS IN
संबंधित प्रश्न
Clarify the difference.
Distance and displacement
Copy the following table and fill in the blank spaces.
| Quantity | S.I. Unit | Scalar or Vector |
| Displacement | ___________ | ___________ |
How can you find the following?
Velocity from a displacement – time graph.
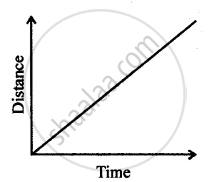
Can you suggest the kind of motion of a body from the following distance – time graph?
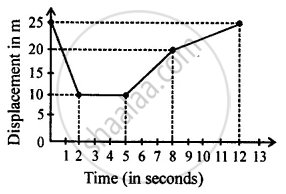
From the displacement – time graph shown given below calculate :
- Velocity between 0 – 2 s.
- Velocity between 8 s – 12 s.
- Average velocity between 5 s – 12 s.
Geetha takes 15 minutes from her house to reach her school on a bicycle. If the bicycle has a speed of 2 m/s, calculate the distance between her house and the school.
Distinguish distance and displacement.
Write a note on the following:
Nautical mile
A particle is moving in a circular pattern of radius r. The displacement after half a circle would be ______.
The rate of change of displacement ______.
