Advertisements
Advertisements
प्रश्न
How can you find the following?
Velocity from a displacement – time graph.
Advertisements
उत्तर
Velocity from a displacement – time graph: Displacement time graph for uniform motion in a straight line (OP) inclined to the time axis. Take any two points A and B on this graph OP. From A and B, draw perpendiculars on the time axis as well as the displacement axis.
So, by knowing the slope of displacement – time graph. We can find the velocity of the body.
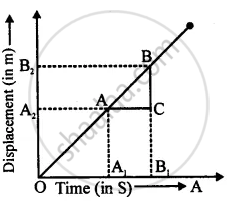
Such that,
OA1 = t1, OB1 = t2, OA2 = x1 and OB2 = x2
Slope of displacement – time graph = `"BC"/"AC"`
= `("x"_2-"x"_1)/("t"_2-"t"_1)=(Δ"x")/(Δ"t")` = Velocity of the body
APPEARS IN
संबंधित प्रश्न
Fill in the following blank with suitable word :
Displacement is a…………………… quantity whereas distance is a………………………….
If on a round trip you travel 6 km and then arrive back home :
What is your final displacement ?
A body travels a distance of 3 km towards East, then 4 km towards North and finally 9 km towards East.
What is the total distance travelled ?
A body when projected up with an initial velocity u goes to a maximum height h in time t and then comes back at the point of projection. The correct statement is ______________
Figure (a) shows the velocity-time graph for the motion of a body. Use it to find the displacement of the body at t = 1 s, 2 s, 3 s and 4 s, then draw on Figure (b), the displacement-time graph for it.
 |
 |
| (a) | (b) |
Write two differences between distance and displacement.
A body is moving along a circular path of radius r. What will be the distance and displacement of the body when it completes:
Two full revolutions
State whether true or false. If false, correct the statement.
Distance covered by a particle never becomes zero but displacement becomes zero.
Distinguish distance and displacement.
The displacement of a moving object in a given interval of time is zero. Would the distance travelled by the object also be zero? Justify your answer.
