Advertisements
Advertisements
Question
Draw velocity – time graph for the following situation:
When a body, is moving with uniform velocity.
Advertisements
Solution
Following is the velocity-time graph:
When a body is moving with uniform velocity: Then a velocity-time graph is AB is a straight line parallel to the time axis.

APPEARS IN
RELATED QUESTIONS
The velocity-time graph for part of a train journey is a horizontal straight line. What does this tell you about its acceleration ?
What can you say about the motion of a body if:
its velocity-time graph is a straight line ?
A body with an initial velocity x moves with a uniform acceleration y. Plot its velocity-time graph.
Draw a velocity-time graph for the free fall of a body under gravity starting from rest. Take g = 10m s-2
The graph of one quantity versus another result in a straight line. How are the quantities related to each other?
Draw the speed-time graph of a body starting from some point P, gradually picking up speed, then running at a uniform speed and finally slowing down to stop at some point Q.
What can you conclude if the speed-time graph of a body is a curve moving upwards starting from the origin?
Interpret the following graph: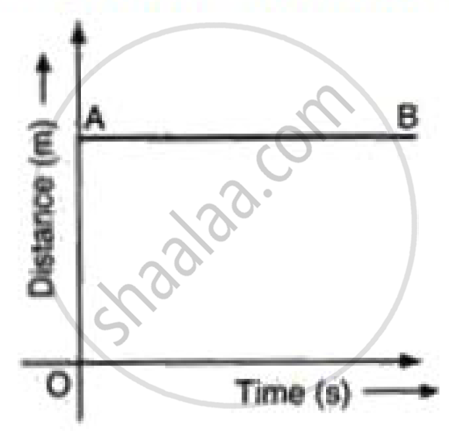
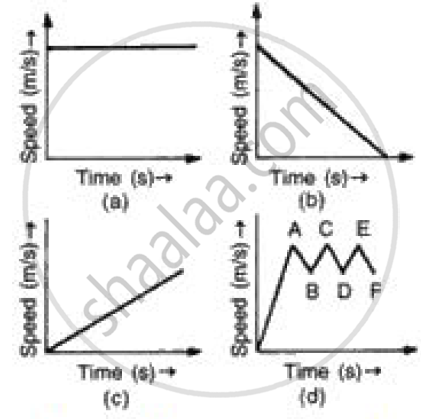
(i) In speed time graph uniform motion is given by a straight line parallel to x axis so figure (a) denotes the uniform motion.
(ii) In speed time graph motion with increasing speed is shown by straight line with positive slope so figure (c) denotes the motion with speed increasing.
(iii) In speed time graph motion with decreasing speed is shown by straight line with negative slope so figure (b) denotes the motion with speed decreasing.
(iv) In speed time graph motion with oscillating speed is shown by zigzag line so figure {d) denotes the motion with speed oscillating.
The area under the v-t graph represents a physical quantity that has the unit.
