Advertisements
Advertisements
Question
Draw the following graph:
Distance versus time for a body at rest.
Advertisements
Solution
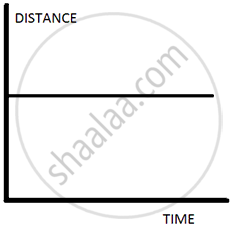
Distance time graph for a body at rest.
APPEARS IN
RELATED QUESTIONS
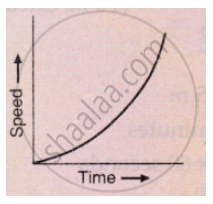
What conclusion can you draw about the acceleration of a body from the speed-time graph shown below .
Show by means of graphical method that: v = u + at, where the symbols have their usual meanings.
A car of mass 1000 kg is moving with a velocity of 10 m s−1. If the velocity-time graph for this car is a horizontal line parallel to the time axis, then the velocity of car at the end of 25 s will be :
Define speed. What is its S.I. unit?
Draw a displacement-time graph for a boy going to school with uniform velocity.
How will you use a speed-time graph to find whether the acceleration of the body is uniform or not?
What does the slope of velocity-time graph represent?
Figure shows the distance-time graph of three students A, B and C. On the basis of the graph, answer the following :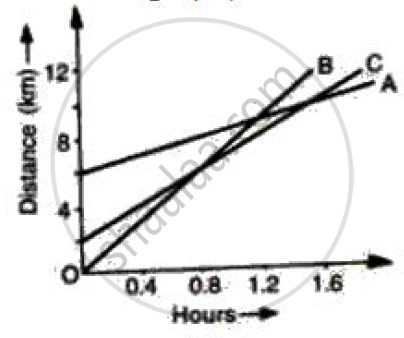
Will the three ever meet at any point on the road?
The slope of the speed–time graph gives ______.
The velocity-displacement graph describing the motion of a bicycle is shown in the figure.

The acceleration-displacement graph of the bicycle's motion is best described by:
