Advertisements
Advertisements
Question
Show by means of graphical method that: v = u + at, where the symbols have their usual meanings.
Advertisements
Solution
Consider the velocity-time graph of a body shown in figure.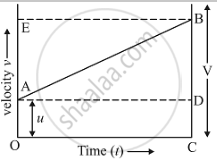
The body has an initial velocity (u) at a point A and then, its velocity changes at a uniform rate from A to B in time, (t). In other words, there is a uniform acceleration (a) from A to B, and after time (t) its final velocity becomes (v) which is equal to BC in the graph. The time (t) is represented by OC. To complete the figure, we draw the perpendicular CB from point C, and draw AD parallel to OC. BE is the perpendicular from point B to OE.
And, final velocity of the body, (v) = BC …… (2)
But from the graph BC = BD + DC
Therefore, v = BD + DC ……(3)
Again DC = OA
So, v = BD + OA
Now, from equation (1),
So, v = BD + u ......(4)
We should find out the value of the slope of a velocity-time graph which is equal to the acceleration,
Thus, Acceleration,
`a = "BD"/"AD"`
But AD = OC = t, so putting t in place of AD in the above relation, we get,
`a = "BD"/t`
So, BD = at
Now, putting this value of BD in equation (4), we get the 1st equation of motion-:
`v = u + at`
where,
(a) - Acceleration
(v) - Final velocity
(u) - Initial velocity
(t) - Time taken
APPEARS IN
RELATED QUESTIONS
Study the speed-time graph of a car given alongside and answer the following questions:
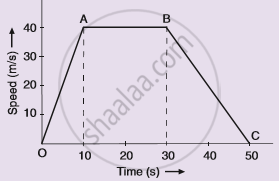
(i) What type of motion is represented by OA ?
(ii) What type of motion is represented by AB ?
(iii) What type of motion is represented by BC ?
(iv) What is the acceleration of car from O to A ?
(v)What is the acceleration of car from A to B ?
(vi) What is the retardation of car from B to C ?
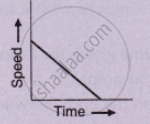
What type of motion is represented by the following graph ?
Define speed. What is its S.I. unit?
What does the area of an acceleration – time graph represent?
How does the slope of a speed-time graph give the acceleration of a body moving along a straight line?
Draw the speed-time graph of a body starting from some point P, gradually picking up speed, then running at a uniform speed and finally slowing down to stop at some point Q.
Draw the following graph:
Distance versus time for a body at rest.
What can you say about the nature of motion of a body of its displacement-time graph is:
A straight line parallel to line axis?
Draw velocity-time graph to show:
Deceleration
Write a sentence to explain the shape of graph.
Derive the equation
S = ut+ `1/2` at2
Using a speed- time graph
