Advertisements
Advertisements
Question
What does the area of an acceleration – time graph represent?
Options
Uniform velocity
Displacement
Distance
Variable velocity
Advertisements
Solution
Variable velocity
APPEARS IN
RELATED QUESTIONS
Draw a velocity-time graph to show the following motion :
A car accelerates uniformly from rest for 5 s ; then it travels at a steady’ velocity for 5 s.
Multiple choice Question. Select the correct option.
A graph is a straight line parallel to the time axis in a distance-time graph. From the graph, it implies:
Multiple choice Question. Select the correct option.
In the velocity-time graph, the acceleration is
Multiple choice Question. Select the correct option.
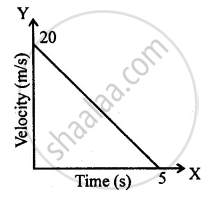
The distance covered in the adjoining velocity-time graph is :
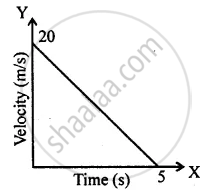
Diagram shows a velocity – time graph for a car starting from rest. The graph has three sections AB, BC and CD.

From a study of this graph, state how the distance travelled in any section is determined.
Draw the following graph:
Distance versus time for a body at rest.
What can you say about the nature of motion of a body of its displacement-time graph is:
A straight line inclined to the time axis with an acute angle?
Draw distance-time graph to show:
Decreasing velocity
Draw velocity-time graph to show:
Deceleration
Write a sentence to explain the shape of graph.
The area under the v-t graph represents a physical quantity that has the unit.
