Advertisements
Advertisements
Question
Draw a velocity-time graph to show the following motion :
A car accelerates uniformly from rest for 5 s ; then it travels at a steady’ velocity for 5 s.
Advertisements
Solution
we have to draw a velocity verses time curve for a moving body . 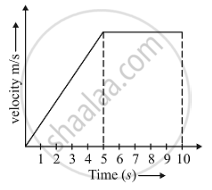
APPEARS IN
RELATED QUESTIONS
What can you say about the motion of a body if its speed-time graph is a straight line parallel to the time axis ?
Show by using the graphical method that: `s=ut+1/2at^2` where the symbols have their usual meanings.
For uniform motion _________
Multiple choice Question. Select the correct option.
A graph is a straight line parallel to the time axis in a distance-time graph. From the graph, it implies:
Diagram is given below shows velocity – time graph of car P and Q, starting from the same place and in the same direction. Calculate at what time intervals both cars have the same velocity?

The area under a speed-time graph in a given intervals gives the total distance covered by a body irrespective of its motion being uniform or non-uniform.
The area of the right triangle under a speed-time graph is 500 m, in a time interval of 20 s. What is the speed of the body? Is the motion uniform or non-uniform?
Draw the speed-time graph of a body when its initial speed is not zero and the speed increases uniformly with time.
What can you conclude if the speed-time graph of a body is a straight line sloping upwards and not passing through the origin?
Figure shows the distance-time graph of three students A, B and C. On the basis of the graph, answer the following :
How far did B travel between the time he passed C and A?
