Advertisements
Advertisements
Question
The area under a speed-time graph in a given intervals gives the total distance covered by a body irrespective of its motion being uniform or non-uniform.
Advertisements
Solution
Yes area under a speed time graph in a given interval gives the total distance covered by a body.
APPEARS IN
RELATED QUESTIONS
Study the speed-time graph of a car given alongside and answer the following questions:
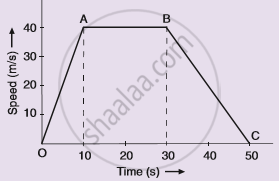
(i) What type of motion is represented by OA ?
(ii) What type of motion is represented by AB ?
(iii) What type of motion is represented by BC ?
(iv) What is the acceleration of car from O to A ?
(v)What is the acceleration of car from A to B ?
(vi) What is the retardation of car from B to C ?
Draw a displacement-time graph for a boy going to school with uniform velocity.
Diagram shows a velocity – time graph for a car starting from rest. The graph has three sections AB, BC and CD.

Compare the distance travelled in section BC with the distance travelled in section AB.
Diagram shows a velocity – time graph for a car starting from rest. The graph has three sections AB, BC, and CD.
In which section, car has a zero acceleration?
Draw the following graph:
Speed versus time for a stepped motion
Draw distance-time graph to show:
Uniform velocity
The area under the v-t graph represents a physical quantity that has the unit.
Slope of the velocity-time graph gives ______.
The area of the velocity-time graph gives the displacement of the body.
If the velocity-time graph has the shape AMB, what would be the shape of the corresponding acceleration-time graph?

