Advertisements
Advertisements
Question
Given below are the speed -time graphs. Match them with their corresponding motions :
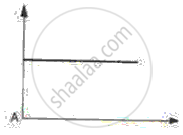 |
(a) Uniformity retared motion |
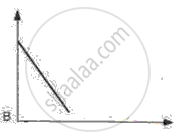 |
(b) Non-uniformity acceleration |
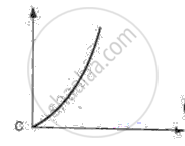 |
(c) Non-uniform motion |
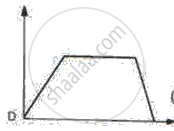 |
(d) uniform motion |
Advertisements
Solution
|
(d) uniform motion |
|
(a) Uniformity retared motion |
|
(b) Non-uniformity acceleration |
|
(c) Non-uniform motion |
APPEARS IN
RELATED QUESTIONS
Draw velocity – time graph for the following situation:
When a body is moving with variable velocity, but uniform acceleration.
Diagram shows a velocity – time graph for a car starting from rest. The graph has three sections AB, BC and CD.
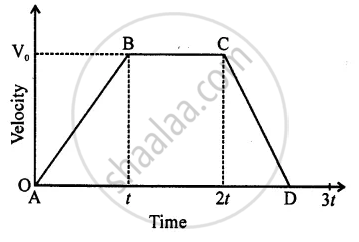
From a study of this graph, state how the distance travelled in any section is determined.
From the velocity – time graph given below, calculate Distance covered in the region ABCE.
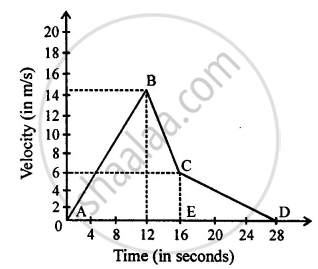
The area under a speed-time graph in a given intervals gives the total distance covered by a body irrespective of its motion being uniform or non-uniform.
The area of the right triangle under a speed-time graph is 500 m, in a time interval of 20 s. What is the speed of the body? Is the motion uniform or non-uniform?
Interpret the following graph: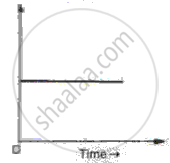
Draw velocity-time graph to show:
Zero acceleration
Write a sentence to explain the shape of graph.
The area under the v-t graph represents a physical quantity that has the unit.
A straight line parallel to the x-axis in the velocity-time graph represents the object moving in ______.
If the velocity-time graph has the shape AMB, what would be the shape of the corresponding acceleration-time graph?

