Advertisements
Advertisements
Question
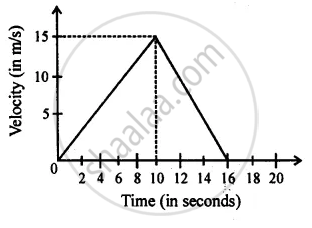
From the diagram given below, calculate acceleration.
Advertisements
Solution
Acceleration = Slope of v.t. graph from O to A
= `"AC"/"OC"=15/10` = 1.5 m/s2
APPEARS IN
RELATED QUESTIONS
State the type of motion represented by the following sketches in Figures.
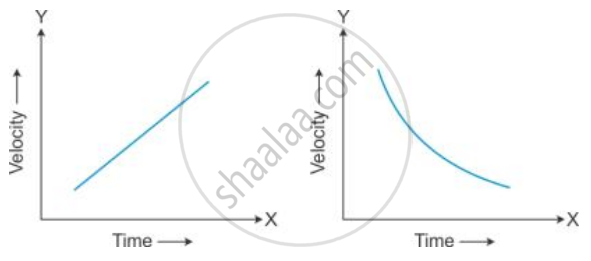
Give an example of each type of motion.
State its value in C.G.S. as well as in S.I. system.
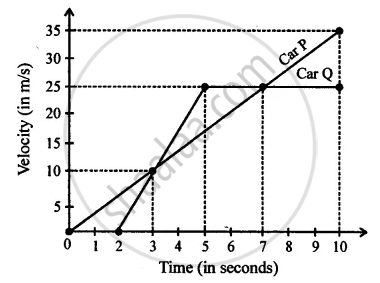
Diagram is given below shows velocity – time graph of car P and Q, starting from the same place and in the same direction. Calculate the Acceleration of car P.
A motorbike, initially at rest, picks up a velocity of 72 kmh−1 over a distance of 40 m. Calculate
- acceleration
- time in which it picks up above velocity.
Is it possible for an accelerating body to have constant speed?
The graph shows how the velocity of a scooter varies with time in 50 s.
Work out: Acceleration.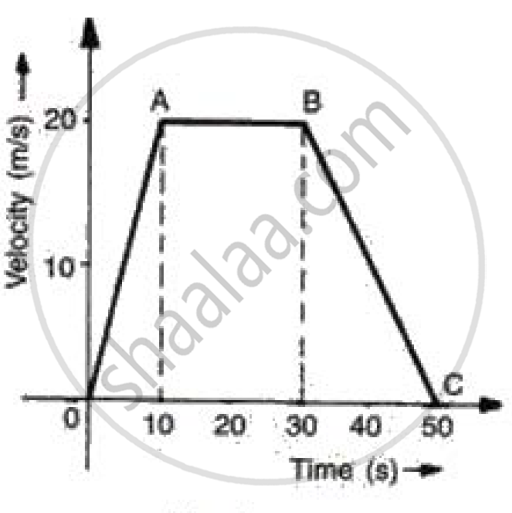
The graph shows how the velocity of a scooter varies with time in 50 s.
Work out: Deceleration
What do you mean by constant acceleration?
A car is being driven at a speed of 20ms-1 when brakes are applied to bring it to rest in 5 s. The deceleration produced in this case will be ______.
Assertion: Position-time graph of a stationary object is a straight line parallel to the time axis.
Reason: For a stationary object, the position does not change with time.
