Advertisements
Advertisements
प्रश्न
Draw distance-time graph to show:
Decreasing velocity
Advertisements
उत्तर

As slope of this line is negative so this represent decreasing velocity.
APPEARS IN
संबंधित प्रश्न
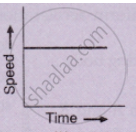
What type of motion is represented by the following graph ?
Define speed. What is its S.I. unit?
Draw a velocity-time graph for the free fall of a body under gravity starting from rest. Take g = 10m s-2
What does the area of an acceleration – time graph represent?
Draw displacement – time graph for the following situation:
When a body is stationary.
From the velocity – time graph given below, calculate Average velocity in region CED.

What can you conclude if the speed-time graph of a body is a straight line sloping upwards and not passing through the origin?
Draw the following graph:
Speed versus time for a uniformly retarded motion.
Interpret the following graph: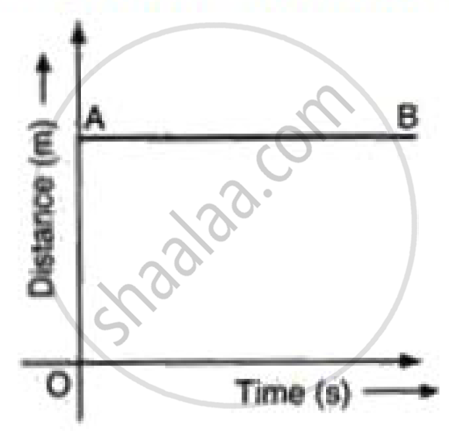
Mention the uses of the velocity-time graph.
