Advertisements
Advertisements
प्रश्न
Draw distance-time graph to show:
Decreasing velocity
Advertisements
उत्तर

As slope of this line is negative so this represent decreasing velocity.
APPEARS IN
संबंधित प्रश्न
What can you say about the motion of a body if:
its velocity-time graph is a straight line ?
The speed-time graph of an ascending passenger lift is given alongside. What is the acceleration of the lift:
(1) during the first two seconds ?
(2) between second and tenth second ?
(3) during the last two seconds ?
Draw a velocity-time graph for the free fall of a body under gravity starting from rest. Take g = 10m s-2
For uniform motion _________
Diagram shows a velocity – time graph for a car starting from rest. The graph has three sections AB, BC and CD.

From a study of this graph, state how the distance travelled in any section is determined.
Interpret the following graph: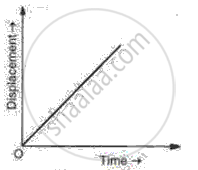
Figure shows the velocity-time graphs for two objects A and B moving in same direction . Which object has the greater a cceleration?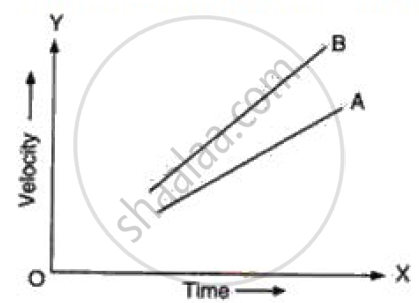
Figure shows the distance-time graph of three students A, B and C. On the basis of the graph, answer the following :
How far did B travel between the time he passed C and A?
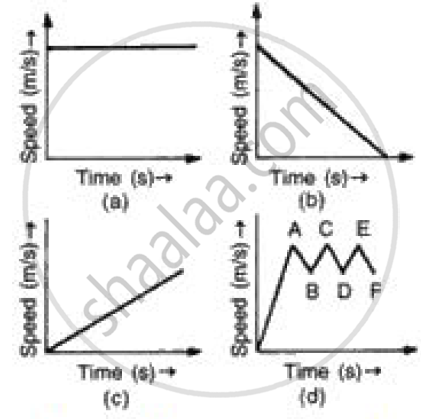
(i) In speed time graph uniform motion is given by a straight line parallel to x axis so figure (a) denotes the uniform motion.
(ii) In speed time graph motion with increasing speed is shown by straight line with positive slope so figure (c) denotes the motion with speed increasing.
(iii) In speed time graph motion with decreasing speed is shown by straight line with negative slope so figure (b) denotes the motion with speed decreasing.
(iv) In speed time graph motion with oscillating speed is shown by zigzag line so figure {d) denotes the motion with speed oscillating.
State whether true or false. If false, correct the statement.
The velocity – time graph of a particle falling freely under gravity would be a straight line parallel to the x axis.
