Advertisements
Advertisements
प्रश्न
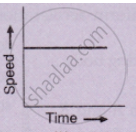
The speed-time graph of an ascending passenger lift is given alongside. What is the acceleration of the lift:
(1) during the first two seconds ?
(2) between second and tenth second ?
(3) during the last two seconds ?
Advertisements
उत्तर
(i) We have to find the acceleration from the given graph.
Acceleration = slope of line AB
= `((4.6-0))/((2-0)) "m/s"^2`
= 2.3 `"m/s"^2`
(ii) Between second and tenth second, it represents uniform speed, so, acceleration acting on the lift is zero.
(iii) During the last two seconds, it represents retardation of the lift, so its acceleration is (–2.3 m/s2).
APPEARS IN
संबंधित प्रश्न
Show by means of graphical method that: v = u + at, where the symbols have their usual meanings.
A body with an initial velocity x moves with a uniform acceleration y. Plot its velocity-time graph.
A body is moving uniformly in a straight line with a velocity of 5 m/s. Find graphically the distance covered by it in 5 seconds.
What type of motion is represented by the following graph ?
Draw displacement – time graph for the following situation:
When a body is stationary.
Interpret the following graph: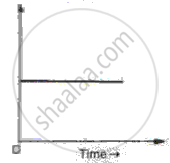
Figure shows the velocity-time graphs for two objects A and B moving in same direction . Which object has the greater a cceleration?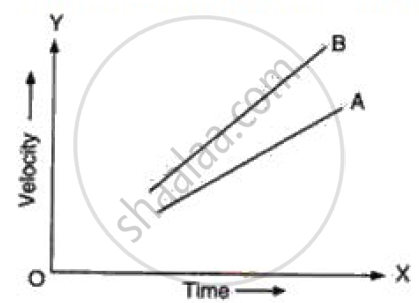
Derive the equation
S = ut+ `1/2` at2
Using a speed- time graph
Mention the uses of the velocity-time graph.
A straight line parallel to the x-axis in the velocity-time graph represents the object moving in ______.
